
China's Shanghai Index At Its Tipping Point?
This ZeroHedge article article caught my attention Friday night...

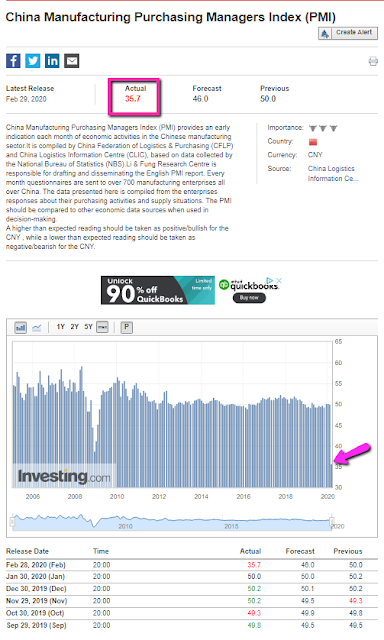
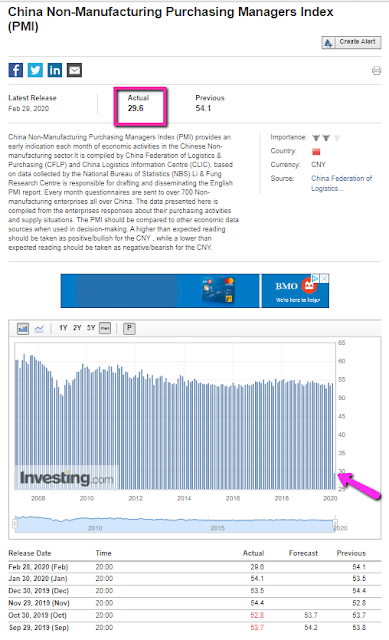
Here are the reports and graphs of the respective China PMI numbers that were released late Friday (courtesy of Investing.com)...catastrophic February data, indeed...

I recently wrote about China's Shanghai Index (SSEC) here and here. The first chart below shows daily price action for the past two years.
It's been having a tough time staying above 3000 and has been recently been bouncing in between that level and 2700 for the past year. It filled its prior large gap down from the beginning of February, but failed, once again, to retake and hold 3000 and has fallen back into this volatile trendless consolidation zone.

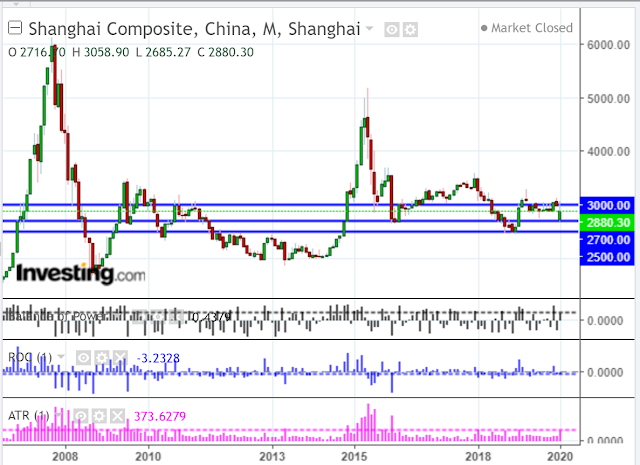
The second chart shows a longer monthly view of price action since 2008. I'll repeat the comments from my post of February 3, as they're still relevant...
"Price has been trapped in a large sideways trading range between 3000 and 2500 since mid-2018...and is now precariously suspended in the middle of this zone.
Essentially, it's had difficulty getting any sustained traction above 3000 since it plunged below in June 2008. When it did manage to break through in December 2014, it was followed by a volatile, parabolic rise and fall back to its current level by the end of 2015. Successive attempts to break out have been increasingly feeble and short-lived.
It's clear, from a charting perspective, that China has been struggling to regain its heady glory days as a stable global economic leader since its bottoming in October 2008, following the global financial crisis.
What's unclear to me, at this time, is when that slump will finally end.
For clues on when this particular rout may be stemmed, I've shown the input value on the ATR (Average True Range) and ROC (Rate-of-change) technical indicators as one period (one month). At the moment, neither of these has spiked to an extreme level, as did occur following the 2008 financial crisis crash and, then, after another drop through to January 2016.
Watch for extreme spikes to form on both of these indicators as a potential sign that a turnaround in market sentiment may, finally, be on the way.
A drop and hold below 2500 could see price plunge further to 2000, or lower, in short order."
I think that the SSEC has reached a turning point and may, in fact, tip to the downside, especially in view of these horrendous economic numbers and in light of the negative effects of the coronavirus, thus far.
In fact, the uncertainty and headwind effects from the virus may extend for some time and, even worsen, so I don't see investors flocking to put their money to work in this long-time under-performing index anytime soon.
The content in my articles is time-sensitive. Each one shows the date and time (New York ET) that I publish them. By the time you read them, market conditions may be quite different than that ...
more

