
Canadian Dollar Price Chart: USD/CAD Breakdown Plummets Into Support
The Canadian Dollar has already covered the entire August range after USD/CAD reversed sharply from key resistance last week. The decline is now testing initial support and while the US Dollar could see some near-term recovery, the broader outlook remains weighted to the downside. These are the updated targets and invalidation levels that matter on the USD/CAD charts.
CANADIAN DOLLAR PRICE CHART – USD/CAD DAILY
(Click on image to enlarge)
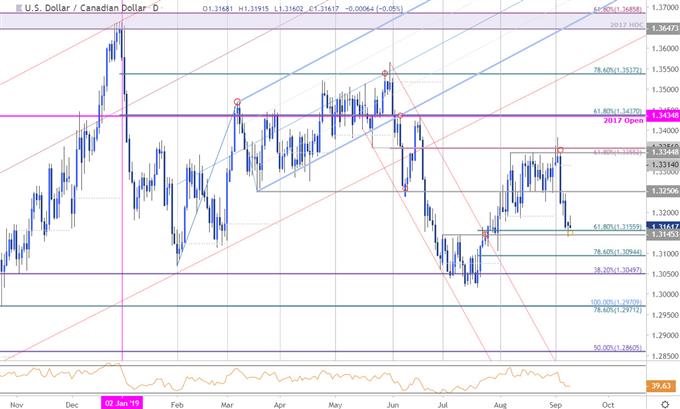
Chart Prepared by Michael Boutros, Technical Strategist; USD/CAD on Tradingview
Technical Outlook: In my most recent Canadian Dollar Price Outlook we noted that, “USD/CAD turned from a technically significant resistance zone this week with the reversal of a near two-month long rally risking further losses for the Dollar.” Price fell 1.8% off the highs with Loonie now testing a key near-term inflection zone at 1.3145/55- a region defined by the 61.8% retracement of the Julye advance and the July opening-range high.
A break / close below this threshold is needed to keep the immediate short-bias viable targeting subsequent support objectives at the78.6% retracement at 1.3094 and 1.3050. Daily resistance stands at 1.3251 with broader bearish invalidation with the monthly open at 1.3314. Note that daily momentum is now probing the 40-level for the first time since the July lows.
CANADIAN DOLLAR PRICE CHART – USD/CAD 240MIN
(Click on image to enlarge)
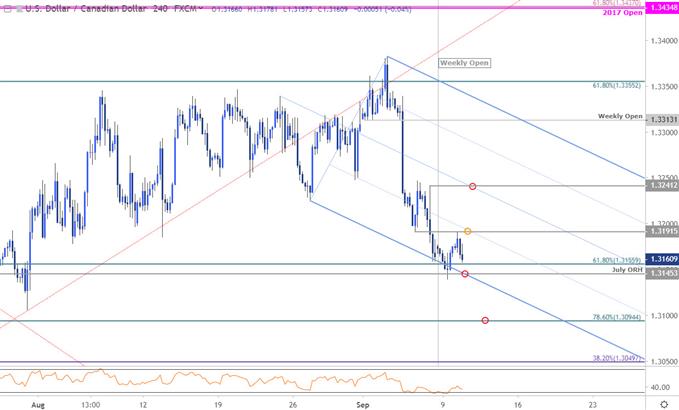
Chart Prepared by Michael Boutros, Technical Strategist; USD/CAD on Tradingview
Notes: A closer look at Loonie price action shows USD/CAD trading within the confines of a descending pitchfork formation with price testing confluence support early in the week at the lower parallel. Initial resistance stands at 1.3192 backed by the median-line / 1.3241 - area of interest for possible exhaustion / short-entries IF reached. Keep an eye on the weekly opening-range which has taken shape just above support with a downside break needed to fuel the next leg lower.
Bottom line: USD/CAD is testing the first major support hurdle on the back of last week’s reversal and we’re looking for a reaction here. From a trading standpoint, a good spot to reduce short-exposure / lower protective stops. IF price fails here, look for exhaustion ahead of downtrend resistance for this to work with a break lower from here likely to trigger the next accelerated drop in price. Review my latest Canadian Dollar Weekly Price Outlook for a longer-term look at the technical picture for USD/JPY.
CANADIAN DOLLAR TRADER SENTIMENT – USD/CAD PRICE CHART
(Click on image to enlarge)
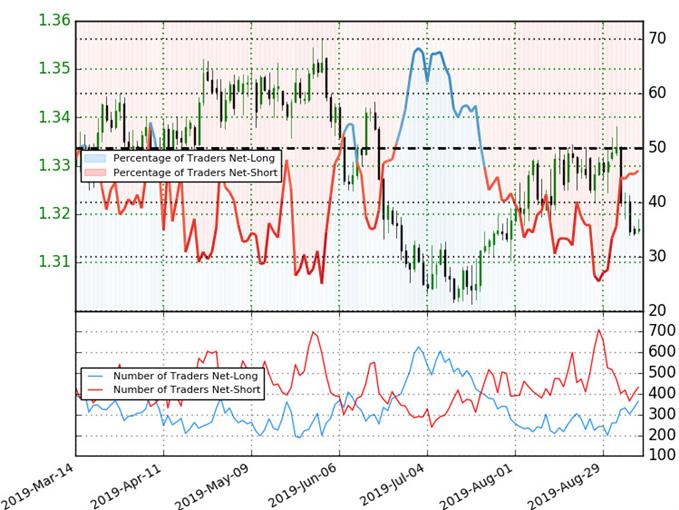
- A summary of IG Client Sentiment shows traders are net-short USD/CAD - the ratio stands at -1.18 (45.8% of traders are long) – neutral reading
- Traders haveremained net-short since July 23rd; price has moved 0.9% higher since then
- Long positions are 10.6% higher than yesterday and 42.2% higher from last week
- Short positions are1.7% higher than yesterday and 17.1% lower from last week
- We typically take a contrarian view to crowd sentiment, and the fact traders are net-short suggests USD/CAD prices may continue to rise. Yet traders are less net-short than yesterday and compared with last week. Recent changes in sentiment warn that the current USD/CAD price trend may soon reverse lower despite the fact traders remain net-short.


