Canadian Dollar Hit Twelve-Month Low As Loonie Fell Back For Fourth Straight Day
Image Source: Unsplash
- The Canadian dollar continued to lose ground on Friday, down 1% on the week.
- Loonie traders will be looking ahead to Canada GDP figures next Tuesday.
- Crude oil prices were also down for the week, further draining support from the Canadian dollar.
The Canadian dollar witnessed more declines on Friday, marking the fourth day lower in a row. It was a relatively quiet market on Friday, but next week brings Canada Gross Domestic Product numbers on Tuesday. Canadian dollar investors may expect to get jostled by US data all through next week.
The Federal Reserve will make another rate call on Wednesday, and US Non-Farm Payrolls are slated for next Friday. The latter coincides with Canadian wages and employment figures.
Daily Digest Market Movers: Canadian Dollar Continued Its Backslide, Loonie Tumbled Against the US Dollar
- The Canadian dollar was down 1.5% on Friday, compared to the week’s highest bids against the US dollar.
- Friday settled as the fourth day of consecutive losses for the Loonie.
- The BoC has a significant uphill battle to climb as inflation risks continue to increase.
- Canadian economic growth is also faltering, limiting the BoC’s policy toolkit.
- Tuesday’s upcoming Canada GDP reading will be important for Canadian dollar traders, as the data could see Canada’s technical recession steepen further.
- Despite risks, the BoC says they’re willing to raise rates further “if needed.”
- Next week will close out with another US NFP print.
Technical Analysis: USD/CAD Hit 12-Month High, Heading for 1.3900
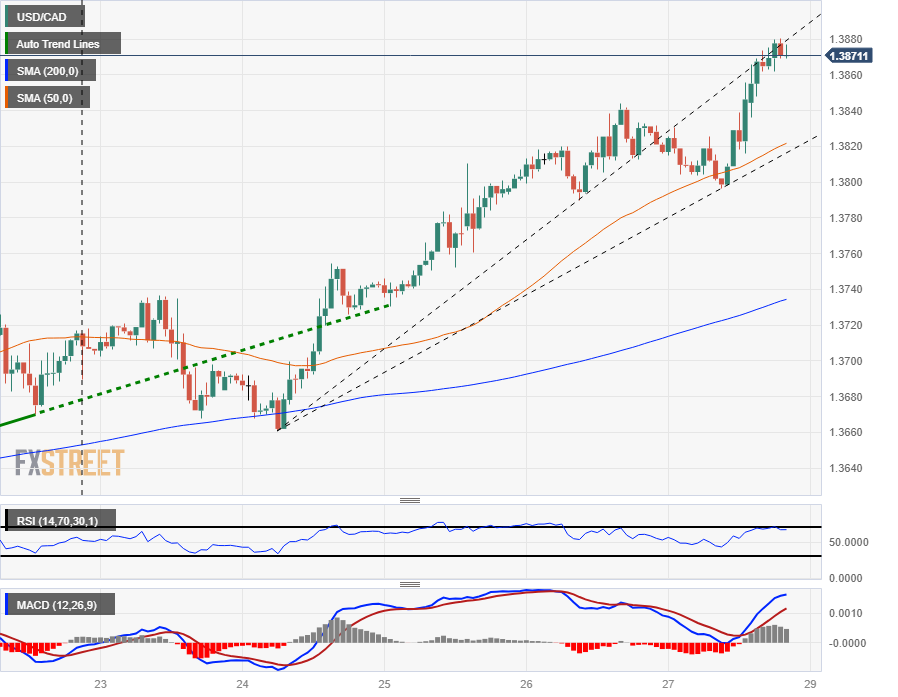
The Canadian dollar was seen slumping into new lows for the year against the US dollar, sending the USD/CAD currency pair toward the 1.3900 handle on Friday. The pair was recently seen trading near the 1.3870 level, and all it would take would be one last push to reclaim the price level the pair hasn’t seen since October 2022.
A technical support zone from 1.3600 to 1.3650 appeared nearby to bump any downside corrections, with the 50-day Simple Moving Average (SMA) seen rising into the 1.3600 handle to add further support.
Further beyond that, the 200-day SMA may turn bullish and catch some lift into the 1.3500 area. The USD/CAD pair has been up nearly 6% from 2023’s bottom bids of 1.3092.
USD/CAD Hourly Chart

(Click on image to enlarge)
US Dollar Price Chart
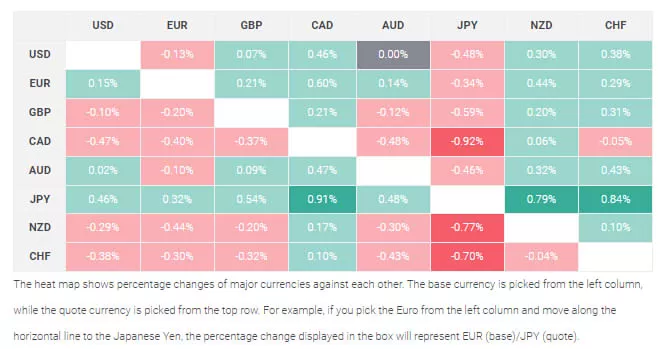
The table below shows the percentage change of US dollar against listed major currencies on Friday. The US dollar was the strongest against the Canadian dollar.

More By This Author:
EUR/USD Pulls Back From Day's High, Fails To Capture 1.0600Gold Price Forecast: XAU/USD Stages Mild Recovery Below $2,000, US PCE Data Eyed
GBP/USD Slides To Over Three-Week Low, Further Below 1.2100 Mark On Stronger USD
Disclosure: Information on this article contains forward-looking statements that involve risks and uncertainties. Markets and instruments profiled on this page are for informational purposes ...
more


