
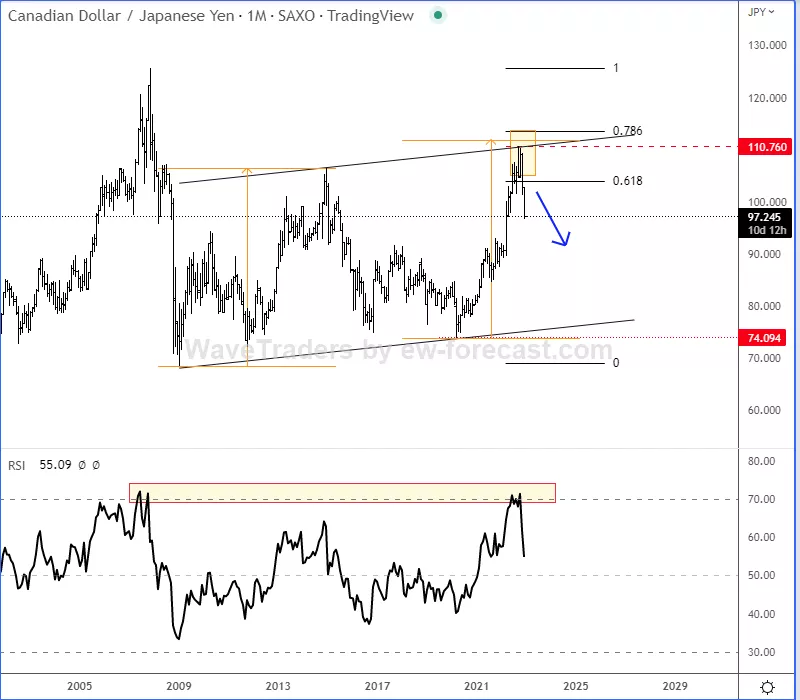
CADJPY has been in the strong uptrend since COVID 2020 March lows.

Looking at the monthly chart, we see it now turning sharply down from important 61,8% – 78,6% Fibonacci retracement and channel resistance line, which signals that 110 resistance can be in place, especially if we consider extreme RSI overbought levels.
If we take a closer look on a daily chart, we can see it potentially trading in a five-wave bearish impulse and the main reason is a decisively broken base channel support line. So, currently we are tracking wave 3, which means that we can expect more downside pressure for wave 5, but ideally after a pullback in wave 4 that can occur soon.
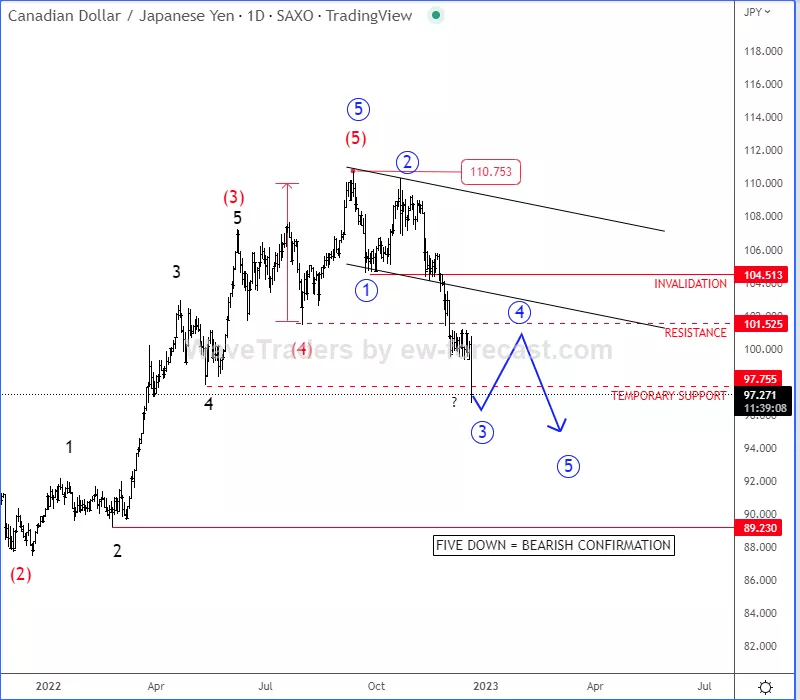
Technically speaking, CADJPY could drop even down to 90 area, but watch out for a temporary corrective slow down within wave 4, where ideal resistance comes around 100 level before a bearish continuation for the 5th wave.
Happy trading!
More By This Author:
Tesla Is Approaching Interesting Support
DSHUSD Is Turning Bullish, But Pullback Can Be Close
10Y US Treasury Notes With An Impulsive Recovery


Comments
Log in or sign up to join the conversation.