British Pound Technical Analysis: GBP/JPY, GBP/USD
The British Pound continues to stage a recovery against the US Dollar following last week’s print of fresh two-year-lows.
The US Dollar has been an absolute freight train of late, posing a near-parabolic like move as the US Federal Reserve continues to hike rates in effort of battling inflation. And while inflation rages elsewhere, the degree of resistance posed by Central Banks varies, and this sees both the Euro and the British Pound fall behind the USD as the Fed aims to tighten policy more than counterparts across the Atlantic. That’s allowed for some very built-in trends to avail themselves; but, as warned last Thursday, trends don’t run in straight lines, and GBP/USD was starting to show tendency of reversal that allowed for pullback themes to develop in the USD.
GBP/USD had built in to a falling wedge pattern last week, often tracked with the aim of bullish reversals. I had also looked into the setup on Wednesday, highlighting an area of prior support that presented resistance potential around the 1.2000 psychological level. That spot is now in-play, and there’s even potential for continuation in the move as we now have both a fresh higher-high to go along with a higher-low.
GBP/USD FOUR-HOUR PRICE CHART
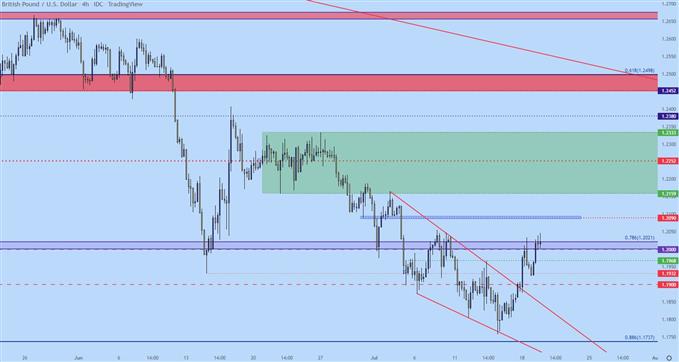
Chart prepared by James Stanley; GBPUSD on Tradingview
Shorter-term, we can see some resistance continuing to play-in off of the Fibonacci level at 1.2021. This is indicative of a brewing pullback. The big question after that is whether support shows at a higher-low, or whether sellers make another decisive move on the chart that quickly brings back USD-strength themes.
As for higher-low support, traders would likely want that to print above the swing low at 1.1923, and there’s two spots between current price and that spot at 1.1968 and 1.1932 that remain of interest.
GBP/USD TWO-HOUR PRICE CHART
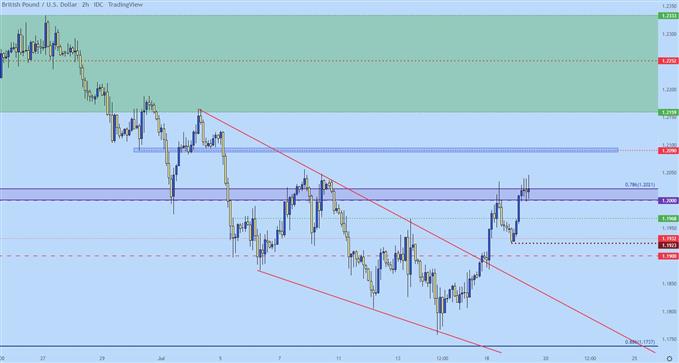
Chart prepared by James Stanley; GBPUSD on Tradingview
GBP/JPY
Longer-term, there’s some remaining bearish potential in here but it appears that we’re at least a few steps away before that theme develops. And I’ll start off with the weekly chart, to really illustrate what we’re dealing with.
The below weekly chart shows extreme indecision over the past few months. In April, prices broke above the 160 psychological level and matters haven’t really been the same since.
GBP/JPY WEEKLY PRICE CHART
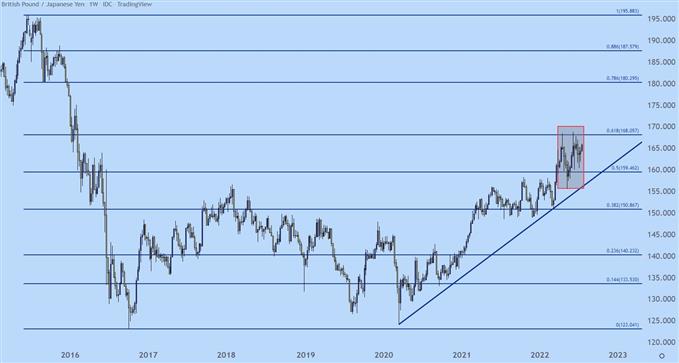
Chart prepared by James Stanley; GBP/JPY on Tradingview
From the daily chart below, the double top starts to come into view and there’s more than 1,000 pips from the top to the neck; so, if that formation does fill-in, the fall could be dramatic. But, that neckline is a ways away at this point and, instead, buyers have been defending psychological levels.
We had the 160 defense in mid-June and that’s currently holding the monthly low in the pair. More recently, the 165 level has been in the picture as resistance-turned-support.
GBP/JPY DAILY PRICE CHART
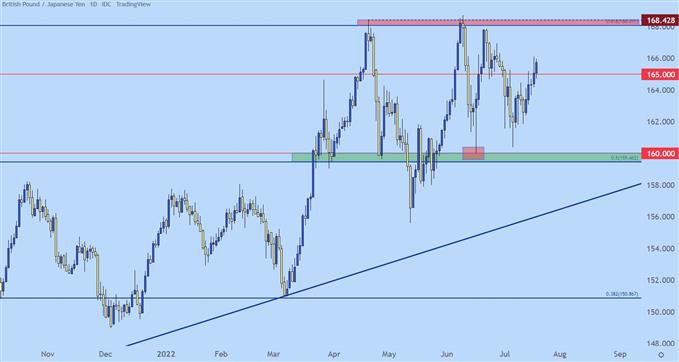
Chart prepared by James Stanley; GBP/JPY on Tradingview
On an even shorter-term basis, GBP/JPY is being constrained by a trendline. This trendline is taken from tops in early and mid-June and, so far, has helped to hold the highs. I wrote about this yesterday, highlighting support in the 164.47-165.00 area. That has since held and the door remains open for bullish potential in the pair, with a breach of 166.10 opening the door for a move up to 166.85. And, after that, the double top is exposed around 168.06.
GBP/JPY FOUR-HOUR PRICE CHART
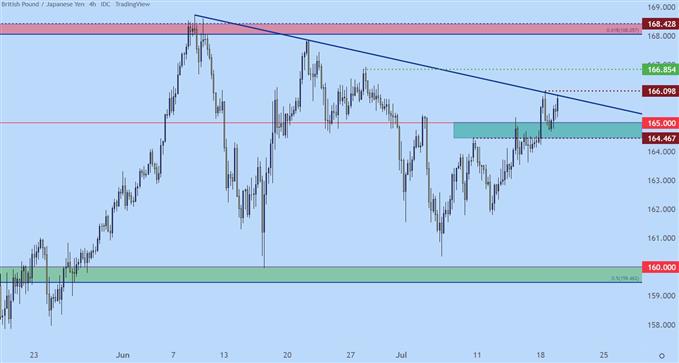
Chart prepared by James Stanley; GBP/JPY on Tradingview
More By This Author:
EUR/USD Latest: Euro Spikes As ECB Sources Discuss Larger Rate HikeBritish Pound (GBP) Forecast: GBP Bid After Strong UK Jobs Market Data
Gold Prices Muted, Crude Oil Rises On USD Pullback As APAC Stocks Fall
Disclosure: See the full disclosure for DailyFX here.


