
The British Pound has given up some ground on Friday and today as the Bank of England rate decision from last week is absorbed by markets. The weakness is largely explained by a stronger US Dollar.

A stellar jobs report in the US on Friday saw the Nasdaq rally and Treasury yields across the curve rise. The 10-year soared above 1.90% and the 2-year leapt over 1.30%, both at their highest levels since the pandemic began.
This saw the US Dollar rally across the board, with the exception of the Euro. Last week’s pivot by the European Central Bank (ECB) to a more hawkish stance continues to be digested by the market.
Currency markets have had a lackluster start to the week, although the growth and commodity linked AUD, CAD, NOK and NZD are all a touch higher in the Asian session.
Iron ore continued to move higher, up over 3.5% on China’s Dalian commodity exchange
today. It is trading above the equivalent of USD 130 a ton. A significant recovery from the November low of USD 82.50.
Gold is flat on the day while silver found support, up over 1.2%. Crude oil has held onto Friday’s gains.
Chinese mainland markets have returned from their Lunar New Year holidays and the CSI 300 equity index played a bit of catch-up as it travelled over 1.5% higher.
Other APAC equity indices were mostly flat on the day, although Australia’s ASX 200 recovered early losses after it was announced that their border will re-open to vaccinated visitors later this month.
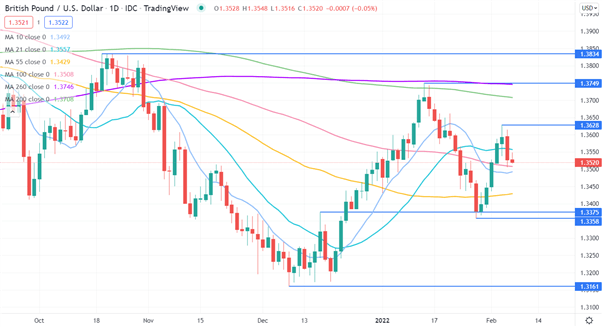
GBP/USD Technical Analysis
GBP/USD has several simple moving averages (SMA) both above and below the current price. This could indicate that the market is lacking directional momentum. In this environment, range trading strategies might out-perform trend trading strategies.
The SMAs themselves may provide support and resistance. Support could also be at the pivot point and prior lows of 1.3375, 1.3358 and 1.3161.
On the topside, resistance might also at the previous highs of 1.3628, 1.3749 and 1.3834. Note that the 200-day SMA also currently coincides with a recent peak at 1.3749.


Comments
Log in or sign up to join the conversation.