Bajaj Finserv Indian Stocks - Elliott Wave Technical Analysis
Bajaj Finserv – BAJAJFINSV (1D Chart) Elliott Wave Technical Analysis
Function: Counter Trend (Minor degree Grey)
Mode: Corrective
Structure: Impulse within larger degree correction
Position: Minor Wave 3 Grey
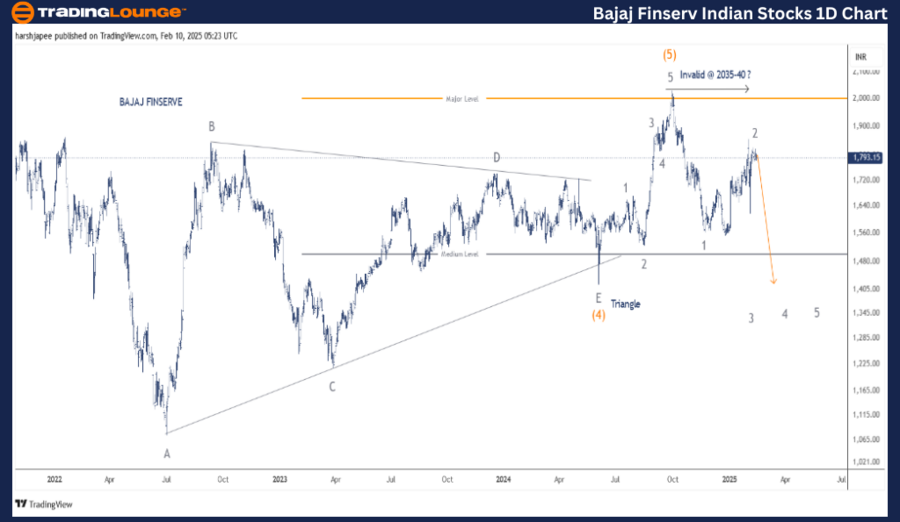
Details: Minor Wave 2 might have terminated just below the 1900 mark. If correct, Minor Wave 3 could be underway and a break below 1540 will accelerate further.
Invalidation point: 2040
BAJAJ FINSRV Daily Chart Technical Analysis and potential Elliott Wave Counts:
BAJAJ FINSRV daily chart indicates a potential top in place around 2035-40 zone, terminating Intermediate Wave (5) Orange. Please note Wave (4) unfolded as a triangle consolidation spanning over 02 years before terminating close to 1420 in June 2024.
The stock has reversed lower since hitting 2035 mark and is in control of bears. The price action and potential wave counts since September 2024 suggest Minor Wave 1 in place around 1560, followed by Minor Wave 2 just below 1900 mark.
Ideally, prices should stay below Wave 2 high around 1850-60, if bears are to remain in control as Minor Wave 3 begins to unfold.
Bajaj Finserv – BAJAJFINSV (4H Chart) Elliott Wave Technical Analysis
Function: Counter Trend (Minor degree Grey)
Mode: Corrective
Structure: Impulse within larger degree correction.
Position: Minor Wave 3 Grey
Details: Minor Wave 2 might have terminated just below the 1900 mark. Minor Wave 1 can be sub divided into five waves at Minute degree; while Wave 2 unfolded as an expanded flat. If correct, Minor Wave 3 could be underway and a break below 1540 will accelerate further.
Invalidation point: 2040
BAJAJ FINSRV 4H Chart Technical Analysis and potential Elliott Wave Counts:
BAJAJ FINSRV 4H chart is highlighting its sub waves after Intermediate Wave (4) Orange terminated as a triangle around 1420 in June 2024. Intermediate Wave (5) rallied through 2035-40 range before reversing sharply lower.
The stock has carved an impulse Minor Wave 1 thereafter, terminating around 1560. The subsequent corrective rally unfolded as an expanded flat terminating potential Minor Wave 2 around 1850-60 range. If the above holds well, Minor Wave 3 could be underway and potential remains towards 1075, beginning of the triangle consolidation.
Conclusion:
BAJAJ FINSRV could be unfolding Minor Wave 3 lower towards 1420 and beyond, against 2035-40 highs.
Elliott Wave Analyst: Harsh Japee
More By This Author:
Elliott Wave Technical Forecast: Northern Star Resources Ltd
Elliott Wave Technical Analysis: Mastercard Inc. - Monday, Feb. 10
Elliott Wave Technical Analysis: British Pound/U.S. Dollar - Monday, Feb. 10
At TradingLounge™, we provide actionable Elliott Wave analysis across over 200 markets. Access live chat rooms, advanced AI & algorithmic charting tools, and curated trade ...
more

.thumb.png.b32eff8b49c4672205c5014e39802450.png)


