
Tuesday’s Asia-Pacific Outlook
Asia-Pacific equity markets, excluding China, look set to rise after a rosy Wall Street session saw major US indexes close with healthy gains. A surprisingly downbeat set of purchasing manager indexes (PMI) from S&P global for the services and manufacturing sectors weighed on Federal Reserve rate hike bets, clearing the way for stock buying. Earnings due over the coming days include Microsoft, Apple, Alphabet, Amazon, Caterpillar, Intel, Via, McDonalds, and Boeing, leaving the rest of the week filled with risk.
The Hang Seng Index (HSI) fell 6.36% on Monday, dropping to its lowest level since April 2009. And it looks like Chinese stocks are in for another down day gauging action in US-listed Chinese equities. The US-traded Nasdaq Golden Dragon China Index fell more than 14% in New York trading. That was the largest one-day percentage drop on record. Traders shrugged off upbeat Q3 GDP growth data and instead focused on President Xi Jinping’s power consolidation, fearing that it may mean a continuance of aggressive Covid-curbing actions.
AUD-sensitive copper prices fell over 1%. Metal demand prospects took a hit after Xi Jinping’s power consolidation, with some fearing an emboldened regime may opt to extend aggressive Covid-curbing policies. Tin prices fell to a fresh 2022 low, and gold and silver prices also moved lower. A surprise contraction in US manufacturing PMI for October also hit metal sentiment. JPMorgan and ICBC Standard Bank Plc have halted business in China’s bonded copper warehouses, according to Bloomberg report.
South Korean consumer confidence for October fell to 88.8 from 91.4 in September. Today’s Asia-Pacific economic calendar is light outside of Australia’s budget, which isn’t due until 08:30 UTC. The Philippines September budget balance, Thailand’s September balance of trade, and Singapore’s September CPI are due out.
Australian Dollar Technical Outlook
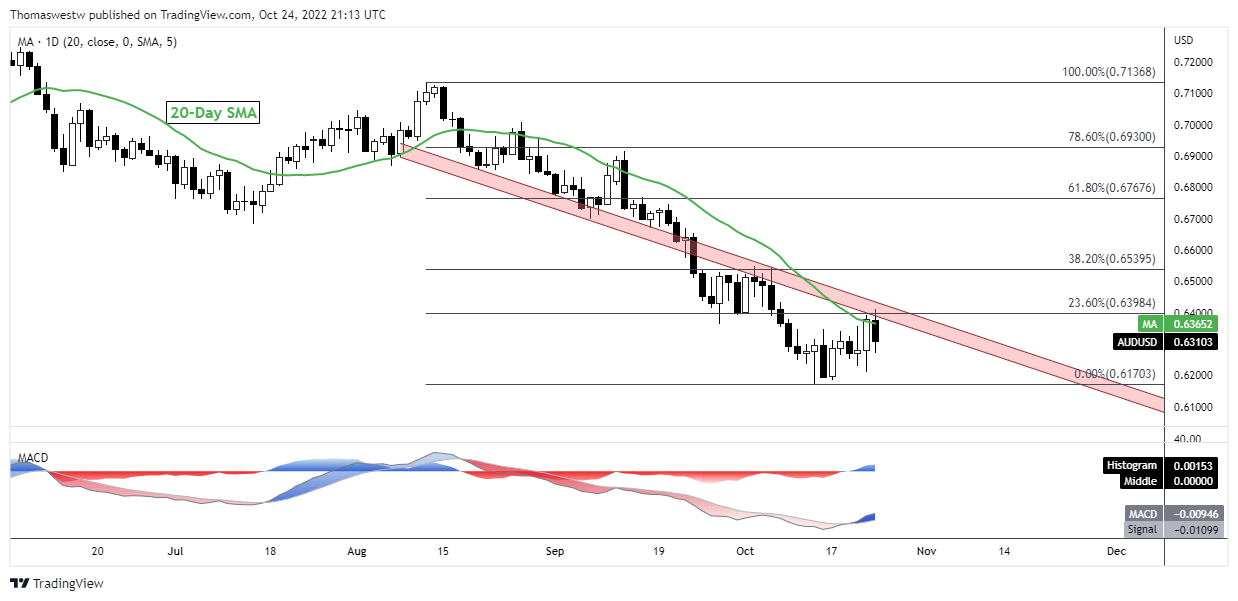
AUD/USD fell from a descending trendline which was also layered with confluent resistance by way of the 20-day Simple Moving Average (SMA) and the 23.6% Fibonacci retracement level from the August/October major move. A break above trendline resistance may restore some confidence, but the path of least resistance looks biased to the downside.
AUD/USD Daily Chart
(Click on image to enlarge)
More By This Author:
Nasdaq 100 Jumps ahead of Microsoft and Alphabet Earnings - What to Expect?S&P 500 Outlook: Corporate Earnings In Focus As Fed Enters Blackout Period
US Composite PMI Slumps As Factory Output Shrinks, Case For Fed Pivot Grows


Comments
Log in or sign up to join the conversation.