
Australian Dollar Price Outlook: Aussie Range Break To Offer Guidance
The Australian Dollar is virtually unchanged against the US Dollar since the Asia-open this week with Aussie trading just below a near-term resistance pivot. While the broader outlook remains constructive, a deeper pullback may offer more favorable entries within the confines of the October advance. These are the updated targets and invalidation levels that matter on the AUD/USD price charts.
AUSTRALIAN DOLLAR PRICE CHART – AUD/USD DAILY
(Click on image to enlarge)
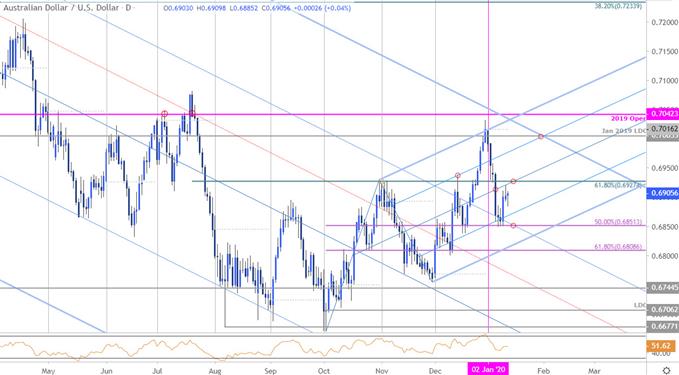
Chart Prepared by Michael Boutros, Technical Strategist; AUD/USD on Tradingview
Technical Outlook: In my last Australian Dollar Weekly Price Outlook we noted that Aussie, “breakout failed at a big resistance zone last week and the risk is for a deeper pullback from here before resumption. From a trading standpoint, look for possible downside exhaustion/opportunity to fade a low on a stretch lower into 6809/27 IF price is indeed heading higher.” Price registered a low at 6849 last week before turning higher – was that the low we were looking for?
AUD/USD has continued to trade within the confines of this ascending pitchfork formation extending off the October / November lows with daily resistance eyed at the median-line / 61.8% retracement at 6927 – a topside breach/close above is needed to validate a larger recovery targeting the January 2019 low-day close / 2020 open at 7005/16. Daily support rests with the 50% retracement at 6851 with a break below 6809 needed to put the bears back in control.
AUSTRALIAN DOLLAR PRICE CHART – AUD/USD 240MIN
(Click on image to enlarge)
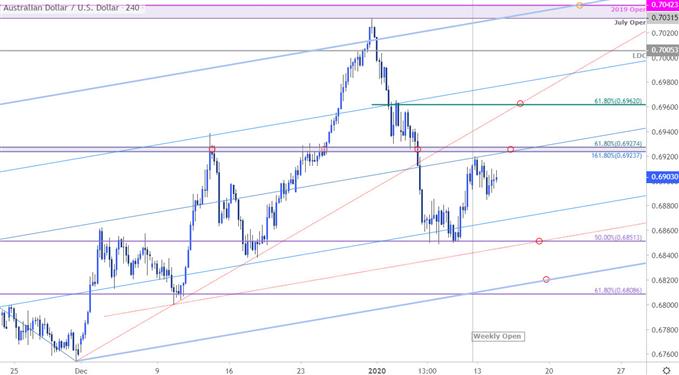
Notes: A closer look at Aussie price action sees AUD/USD carving a weekly opening-range just below near-term resistance at 6923/27 – looking for a reaction here. A breach would expose subsequent resistance objectives at the 61.8% retracement of the decline at 6962- strength beyond this threshold would keep the focus on 7005/16 and key resistance at 7031/42. Interim support rests at 6851 and at the lower parallel (currently 6820s) – both areas of interest for possible downside exhaustion IF reached.
Bottom line: The immediate focus is on a break of the 6851-6927 range for guidance with the broader outlook weighted to the topside in Aussie while above 6809. From a trading standpoint, look for possible downside exhaustion while above the lower parallel with a breach above the median-line needed to mark resumption.
AUSTRALIAN DOLLAR TRADER SENTIMENT – AUD/USD PRICE CHART
(Click on image to enlarge)
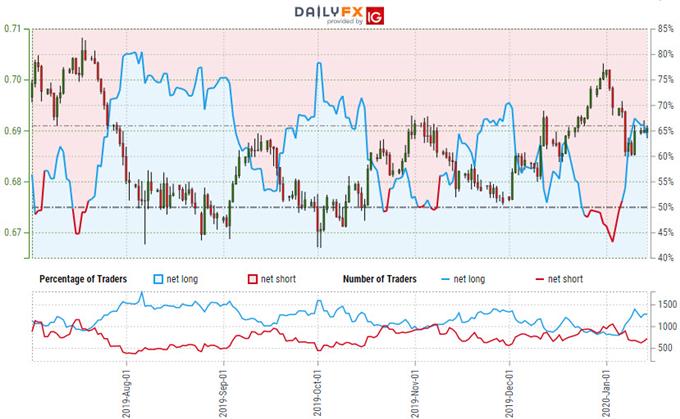
- A summary of IG Client Sentiment shows traders are net-long AUD/USD - the ratio stands at +1.53 (60.53% of traders are long) – bearish reading
- Long positions are 4.47% lower than yesterday and 20.08% higher from last week
- Short positions are8.48% higher than yesterday and 0.65% higher from last week
- We typically take a contrarian view to crowd sentiment, and the fact traders are net-long suggests AUD/USD prices may continue to fall. Yet traders are less net-long than yesterday but more net-long from last week and the combination of current positioning and recent changes gives us a further mixed Aussie trading bias from a sentiment standpoint.


