
Australian Dollar Price Chart: Aussie Defends August Low- Technicals
Aussie probed fresh ten-yearly lows last month with price still trading within the August 5th weekly range. A rebound early in the week has fueled a rally of more than 0.9% with the advance now targeting a critical pivot zone we’ve been tracking for months. Here These are the updated targets and invalidation levels that matter on the AUD/USD weekly price chart.
AUSSIE PRICE CHART – AUD/USD WEEKLY
(Click on image to enlarge)
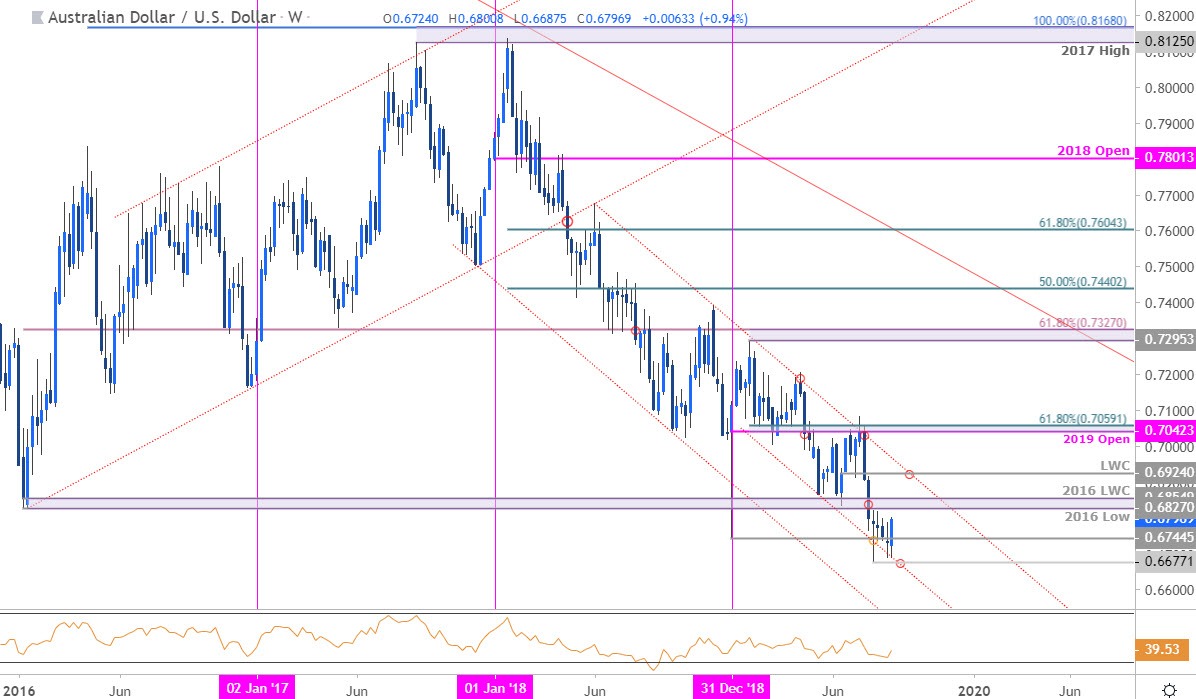
Chart Prepared by Michael Boutros, Technical Strategist; DXY on Tradingview
Notes: In my last Australian Dollar Trade Outlook we highlighted that Aussie was testing near-term support at 6733/45 while noting that, “a break below would expose another run at the lows near 6677 and beyond. We’re on the lookout for a pivot in price down here.” AUD/USD registered at low at 6687 this week with price now on pace to mark an outside-weekly reversal off the lows (if price closes the week at these levels). Note that Kiwi (NZD/USD) probed into fresh yearly lows this week while Aussie held the August lows – this non-confirmation low is often evident around larger turns in price and highlights the risk to the Aussie bears near-term.
Critical resistance remains at the 6827/55 pivot zone- a region define by the 2016 low / low-week close. A breach / weekly close above this threshold is needed to suggest a more significant low was registered this week with such a scenario targeting the June low-day close at 6924. Look for initial support at the January lows at 6745 IF price is indeed heading higher. Ultimately a close below 6677 would be needed to mark resumption of the broader downtrend.
Bottom line: Aussie turned off slope support this week and we’re looking for price to stabilize above 6745for this advance to get some legs. From at trading standpoint, I’ll favor fading weakness while above this threshold targeting 6827/55- look for a bigger reaction there IF reached. I’ll publish an updated AUD/USD Trade Outlook once we get further clarity in near-term price action.
AUSSIE TRADER SENTIMENT – AUD/USD
(Click on image to enlarge)
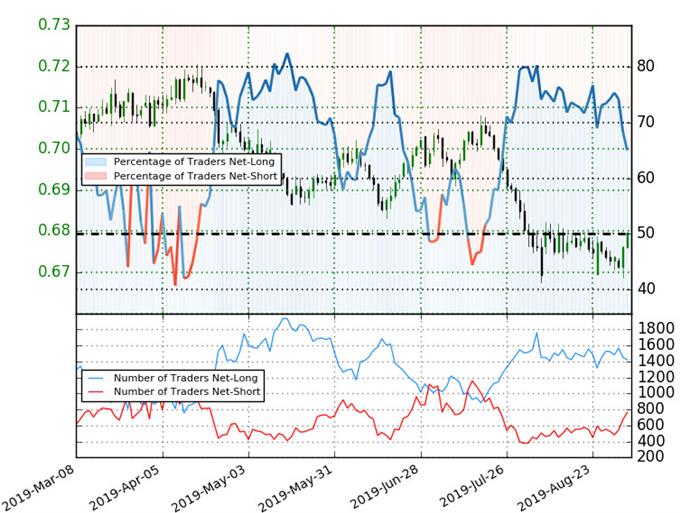
- A summary of IG Client Sentiment shows traders are net-long AUD/USD- the ratio stands at +1.86 (65.0% of traders are long) – bearishreading
- Traders have remained net-long since July 19th; price has moved 3.2% lower since then
- The percentage of traders net-long is now its lowest since July 21st
- Long positions are8.7% lower than yesterday and 7.0% lower from last week
- Short positions are17.7% higher than yesterday and 38.7% higher from last week
- We typically take a contrarian view to crowd sentiment, and the fact traders are net-long suggests AUD/USD prices may continue to fall. Yet traders are less net-long than yesterday and compared with last week. Recent changes in sentiment warn that the current AUD/USD price trend may soon reverse higher despite the fact traders remain net-long.


