
Australian Dollar Outlook: AUD/USD & AUD/JPY Eye RBA Meeting
The September RBA meeting is officially 1-week away and brings the Australian Dollar back in the spotlight. AUDUSD and AUDJPY both plunged to multi-year lows earlier this month driven largely by forex traders fleeing risk and flocking to safety amid rising recession fears and US-China trade war uncertainty. Looking forward, Australian Dollar price action ahead of the September RBA meeting could foreshadow where AUDUSD and AUDJPY may head next.
RESERVE BANK OF AUSTRALIA INTEREST RATE CUT PROBABILITY (SEPTEMBER 2019)
(Click on image to enlarge)
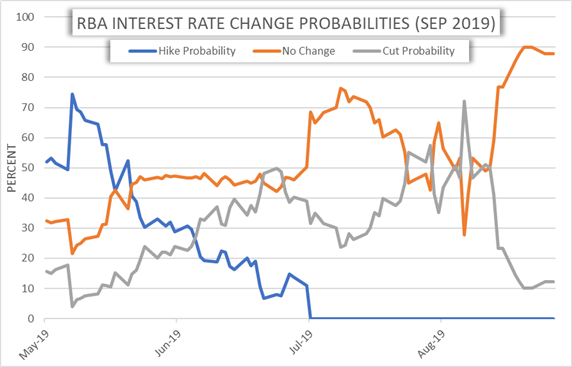
RBA monetary policy expectations have been quite volatile over the last several months as Australia’s central bank tiptoes around daunting downside risks to its economy stemming from the US-China trade war. At the same time, Australian economic data has held up quite solidly – like the latest Australian jobs numbers – and has provided the RBA with a bit of flexibility on monetary policy decisions.
That said, overnight swaps are currently pricing an 87.8% probability that the RBA leaves rates unchanged at the central bank’s next interest rate decision but placing the odds of another RBA rate cut by year-end at 88.0%. A surprise RBA interest rate cut stands to send the Australian Dollar plunging, but this scenario is not likely considering recent commentary from RBA Governor Lowe who hinted at the limitations of monetary policy at the Jackson Hole Economic Symposium last weekend.
AUSTRALIAN DOLLAR 25D RISK REVERSALS (1-WEEK)
(Click on image to enlarge)
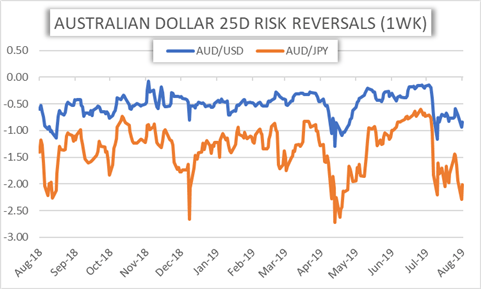
Nevertheless, the currency market’s bias remains tilted to the downside judging by the 1-week risk reversal metrics for AUDUSD and AUDJPY. Yet, the recent influx of market risk appetite following the supposed trade war de-escalation could be contributing to the marginal bump in Australian Dollar risk reversals measures.
AUDUSD PRICE CHART: DAILY TIME FRAME (APRIL 01, 2019 TO AUGUST 27, 2019)
(Click on image to enlarge)
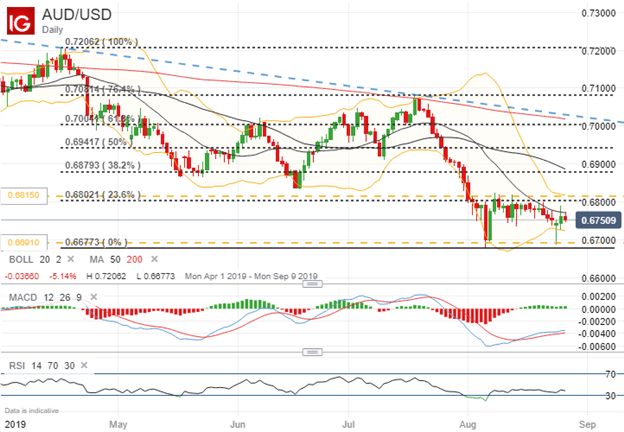
Spot AUDUSD is expected to trade between 0.6691-0.6815 with a 68% statistical probability as calculated using the currency pair’s 1-week implied volatility reading of 7.82%. The 1-standard deviation option implied trading range just so happens to measure up closely with spot AUDUSD’s year-to-date low and 23.6% Fibonacci retracement of its April swing high, which reiterates the major confluence levels as technical support and resistance. We have previously highlighted resistance posed by the 0.6800 handle in our most recent AUDUSD price outlook where we stated that the Australian Dollar could be primed for a breakdown – a view we still hold which may materialize on dovish commentary revealed during the September RBA meeting.
AUDJPY PRICE CHART: DAILY TIME FRAME (APRIL 01, 2019 TO AUGUST 27, 2019)
(Click on image to enlarge)
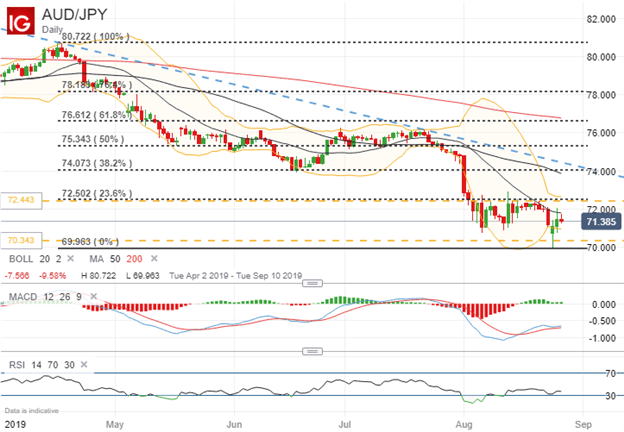
Judging by AUDJPY’s 1-week implied volatility reading of 12.56%, the currency pair is estimated to trade between 70.343-72.443 with a 68% statistical probability. The technical backdrop of AUDJPY is quite similar to that of AUDUSD. Spot AUDJPY has also struggled due to major technical resistance around the 72.000 handle which has served as a major headwind for Australian Dollar bulls.


