

Image Source: Unsplash
- Australian inflation expectations rise, increasing the likelihood that the RBA may hold back on additional rate cuts.
- Inflation trends in the United States ease, raising projections of a Fed rate cut in September.
- The AUD/USD rises as forecasts of a narrowing monetary policy divergence boost gains.
AUD/USD is trading just below key resistance as diverging economic signals between Australia and the United States drive renewed bullish momentum in the pair, which is currently trading at 0.6529, up 0.44% on Thursday.
Traders are closely monitoring Friday’s release of the University of Michigan Consumer Sentiment report and accompanying inflation expectations data.
The preliminary June Consumer Sentiment Index is expected to be 53.5, up from 52.2 in May. Meanwhile, inflation expectations over the 1-year and 5-year horizons were previously reported at 6.6% and 4.2%, respectively.
Any downside surprise in consumer sentiment or signs that inflation expectations remain elevated could heighten volatility in the USD and significantly influence the near-term direction of the AUD/USD exchange rate.
Inflation trends and interest rate expectations lift AUD/USD
Australia’s Consumer Inflation Expectations, reported on Thursday, surged to 5% in June, up from 4.1% in May. This increase has reignited speculation that the Reserve Bank of Australia (RBA) could pause any dovish pivot and maintain a hawkish policy stance in response to persistent inflation concerns.
In contrast, recent data from the United States has highlighted easing inflation trends and a stable labor market.
These developments have solidified expectations for Federal Reserve rate cuts, with markets now pricing in a cut for September.
AUD/USD trades below wedge resistance while bullish momentum builds
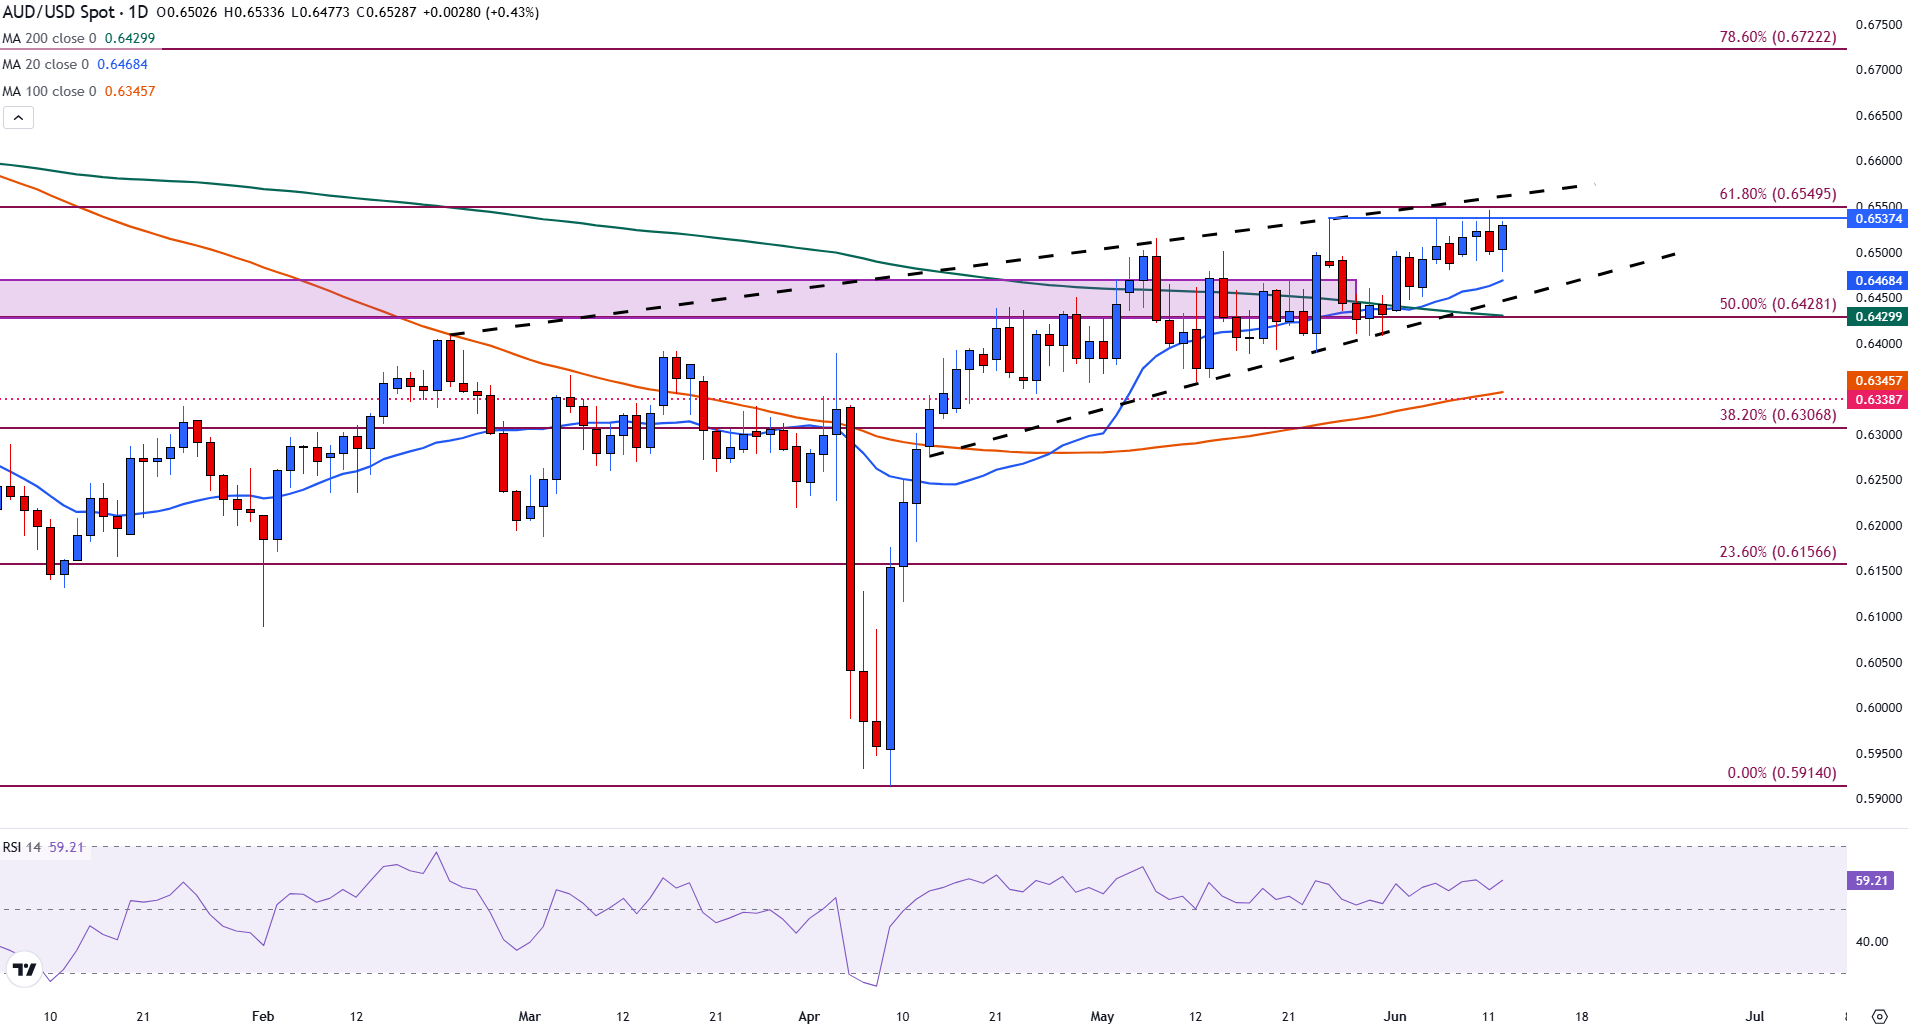
AUD/USD is trading just below key resistance at 0.6537, which marks the upper boundary of the rising wedge pattern on May 26. Above that is 0.6545, which is currently the year-to-date high, reached on Wednesday.
A breakout above 0.6545 could open the door to further upside toward the 0.6600 psychological level, with the 78.6% retracement of the October-April decline at 0.6722 as a more extended target.
On the downside, immediate support is located at the 20-day Simple Moving Average (SMA), near 0.6468, followed by the 200-day SMA at 0.6428, which coincides with the 50% Fibonacci retracement and represents a key level to watch for a potential shift in momentum. The Relative Strength Index (RSI) at 59 suggests that bullish momentum is building but not yet overextended.
AUD/USD daily chart
More By This Author:
WTI Crude Oil Prices Ease After Failing To Test $68.00
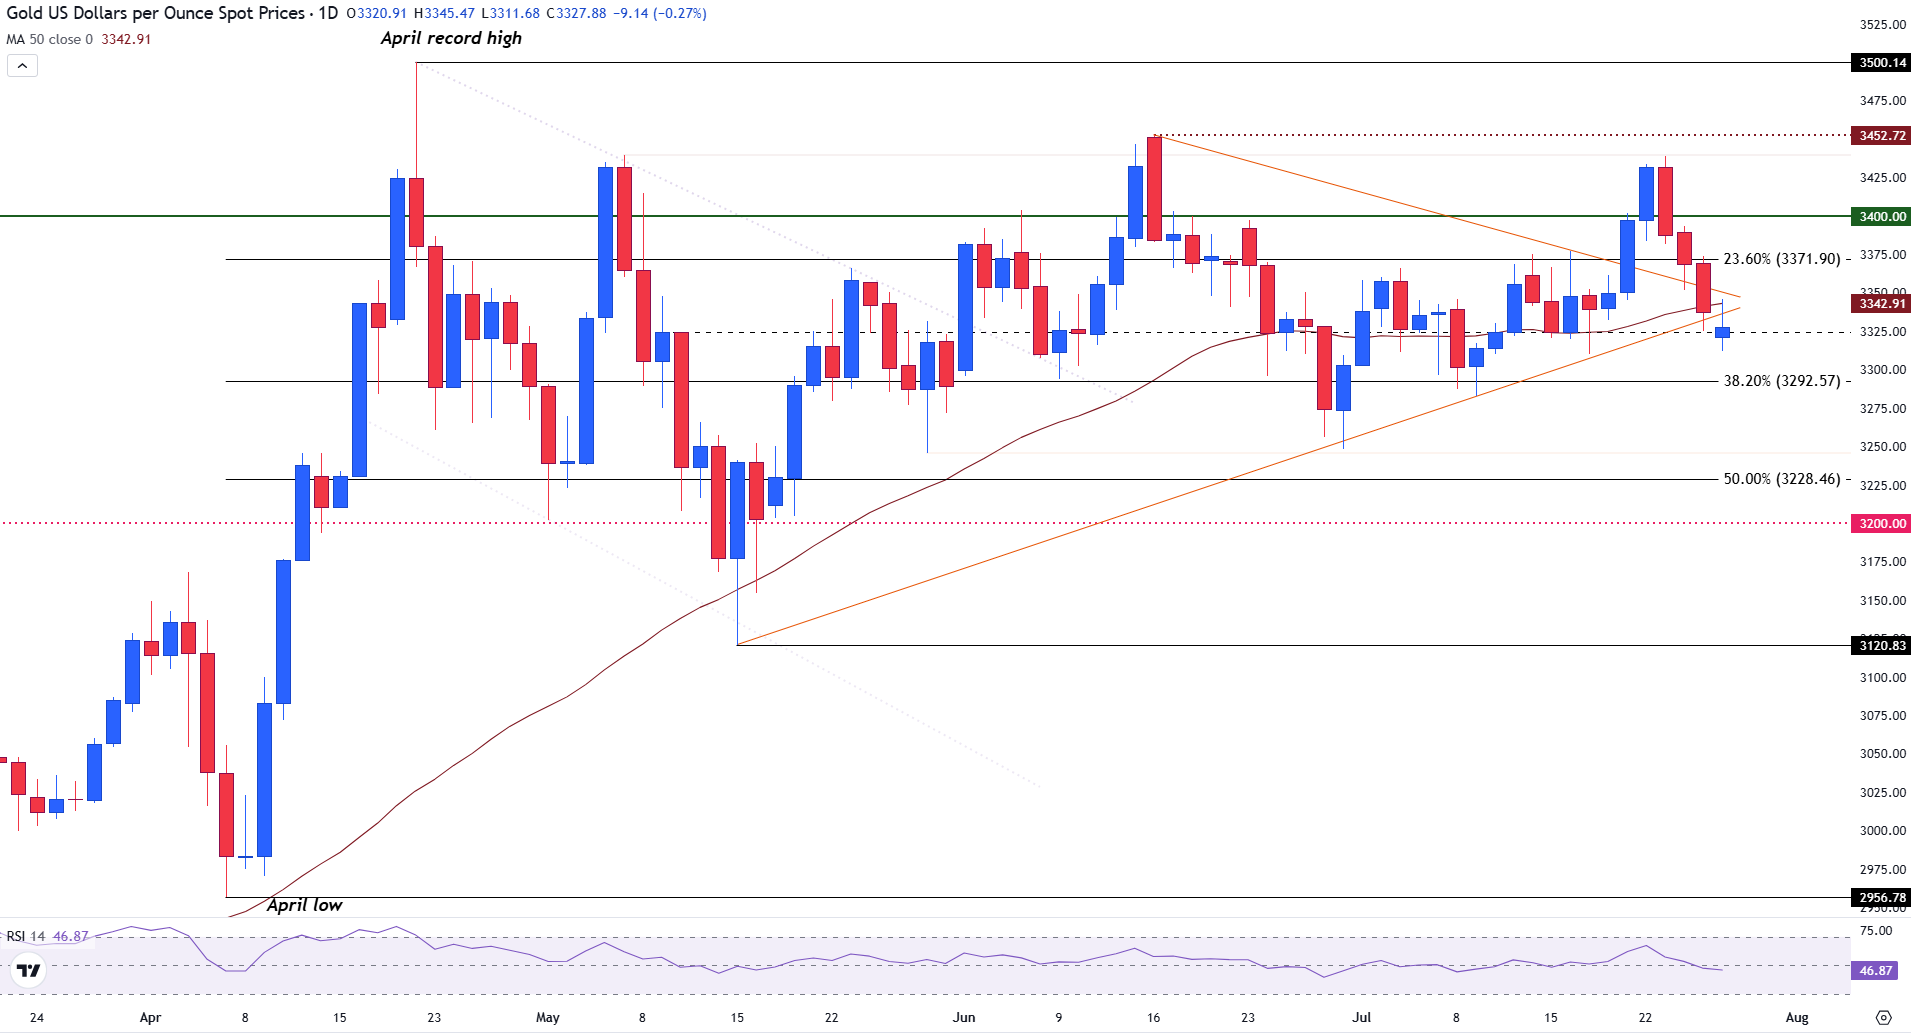
Gold Surges As Israel-Iran Tensions, Renewed Tariffs Threats Support Haven Flows
WTI Oil Prices Rally On US-China Trade Optimism And Declining Inventories


Comments
Log in or sign up to join the conversation.