AUD/JPY Price Analysis: Plunges After RBA’s Dovish Hold, Technicals Hint Downside Risks Remain
Image Source: Unsplash
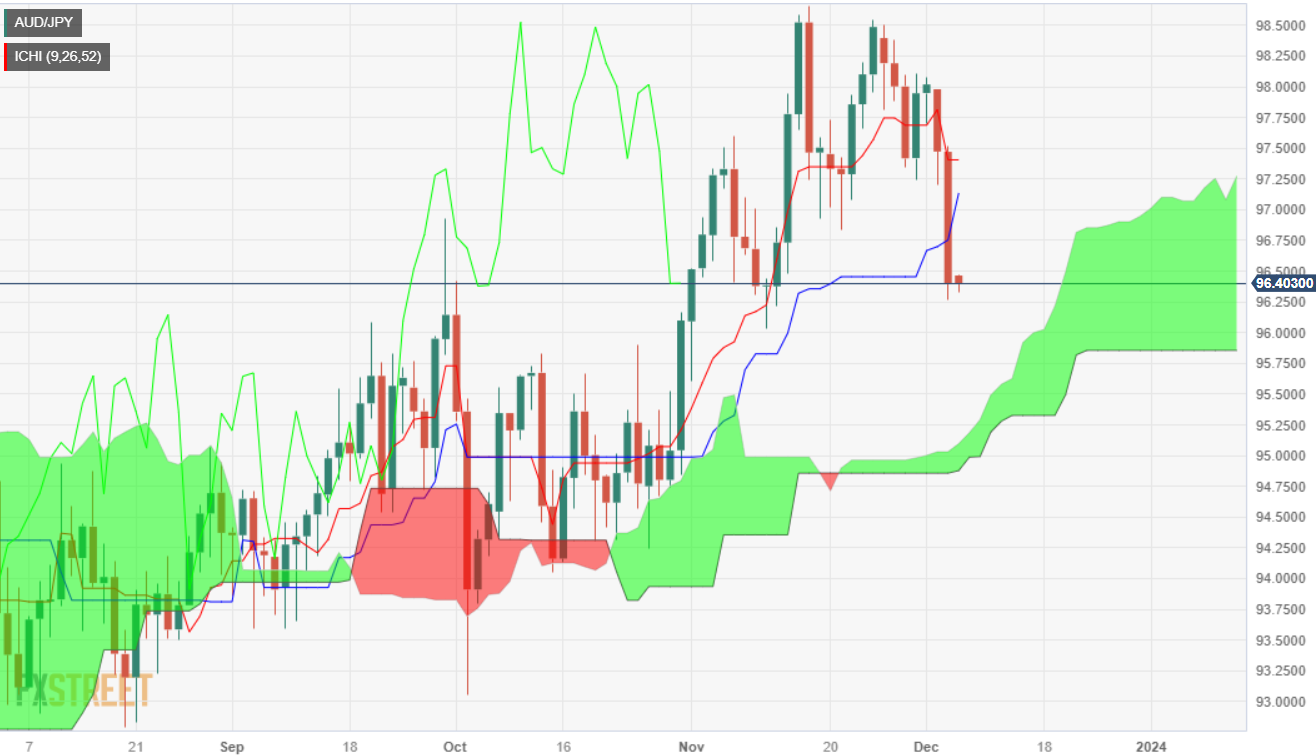
- AUD/JPY dipped below key support levels, like the Kijun-Sen, and Senkou Span.
- The Chikou Span crossing below the price action, and narrowing distance between Tenkan and Kijun-Sen, signals bears are gaining traction.
- If AUD/JPY buyers reclaim 97.00, a rally to 98.00 is on the cards.
The AUD/JPY began Wednesday’s Asian session with a negative tone after registering losses of more than 1% on Tuesday. This is courtesy of the Reserve Bank of Australia (RBA), which held rates unchanged, though market participants perceived the decision as a “dovish hold,” so Aussie Dollar (AUD) sellers exerted downward pressure on the currency. At the time of writing, the pair is exchanging hands at 96.36, down 0.02%.
Despite registering solid losses, the AUD/JPY remains neutral to upward bias, but downside risks are emerging. The Chikou Span is crossing below the price action, turning bearish, and the distance between the Tenkan and Kijun-Sen is narrowing. If the pair slides below the November 10 low of 96.28, that will exert downward pressure on the pair. The next support would be the top of the Ichimoku Cloud (Kumo) at around 95.15/25, followed by the bottom of the Kumo at 94.95.
On the flip side, in the outcome of the AUD/JPY reclaiming the 97.00 figure, buyers could regain control. The next spotted resistance level is the Tenkan-Sen at 97.40, and if the pair gains additional momentum, it could rally toward the 98.00 figure.
AUD/JPY Price Analysis – Daily Chart
(Click on image to enlarge)
AUD/JPY Technical Levels
AUD/JPY
| OVERVIEW | |
|---|---|
| Today last price | 96.41 |
| Today Daily Change | -1.06 |
| Today Daily Change % | -1.09 |
| Today daily open | 97.47 |
| TRENDS | |
|---|---|
| Daily SMA20 | 97.52 |
| Daily SMA50 | 96.2 |
| Daily SMA100 | 95.3 |
| Daily SMA200 | 93.46 |
| LEVELS | |
|---|---|
| Previous Daily High | 97.98 |
| Previous Daily Low | 97.2 |
| Previous Weekly High | 98.5 |
| Previous Weekly Low | 97.24 |
| Previous Monthly High | 98.66 |
| Previous Monthly Low | 95.61 |
| Daily Fibonacci 38.2% | 97.5 |
| Daily Fibonacci 61.8% | 97.68 |
| Daily Pivot Point S1 | 97.12 |
| Daily Pivot Point S2 | 96.77 |
| Daily Pivot Point S3 | 96.34 |
| Daily Pivot Point R1 | 97.9 |
| Daily Pivot Point R2 | 98.33 |
| Daily Pivot Point R3 | 98.68 |
More By This Author:
GBP/USD Slips Below 1.2600 As The Early Week's Selloff Extends Into TuesdayEUR/GBP Remains Vulnerable With Upside Attempts Capped Below 0.8590
AUD/USD Drops Below 0.6600 Following RBA Rate Decision
Disclosure: Information on this article contains forward-looking statements that involve risks and uncertainties. Markets and instruments profiled on this page are for informational purposes ...
more


