
The AUD/JPY pair is currently trading at 98.60, showing a substantial decrease of nearly 1%. Despite this decline, the broader trend continues to show positivity, with bulls maintaining their control. In addition, as the downward movements might be over-extended, the pair may enter a consolidation phase.
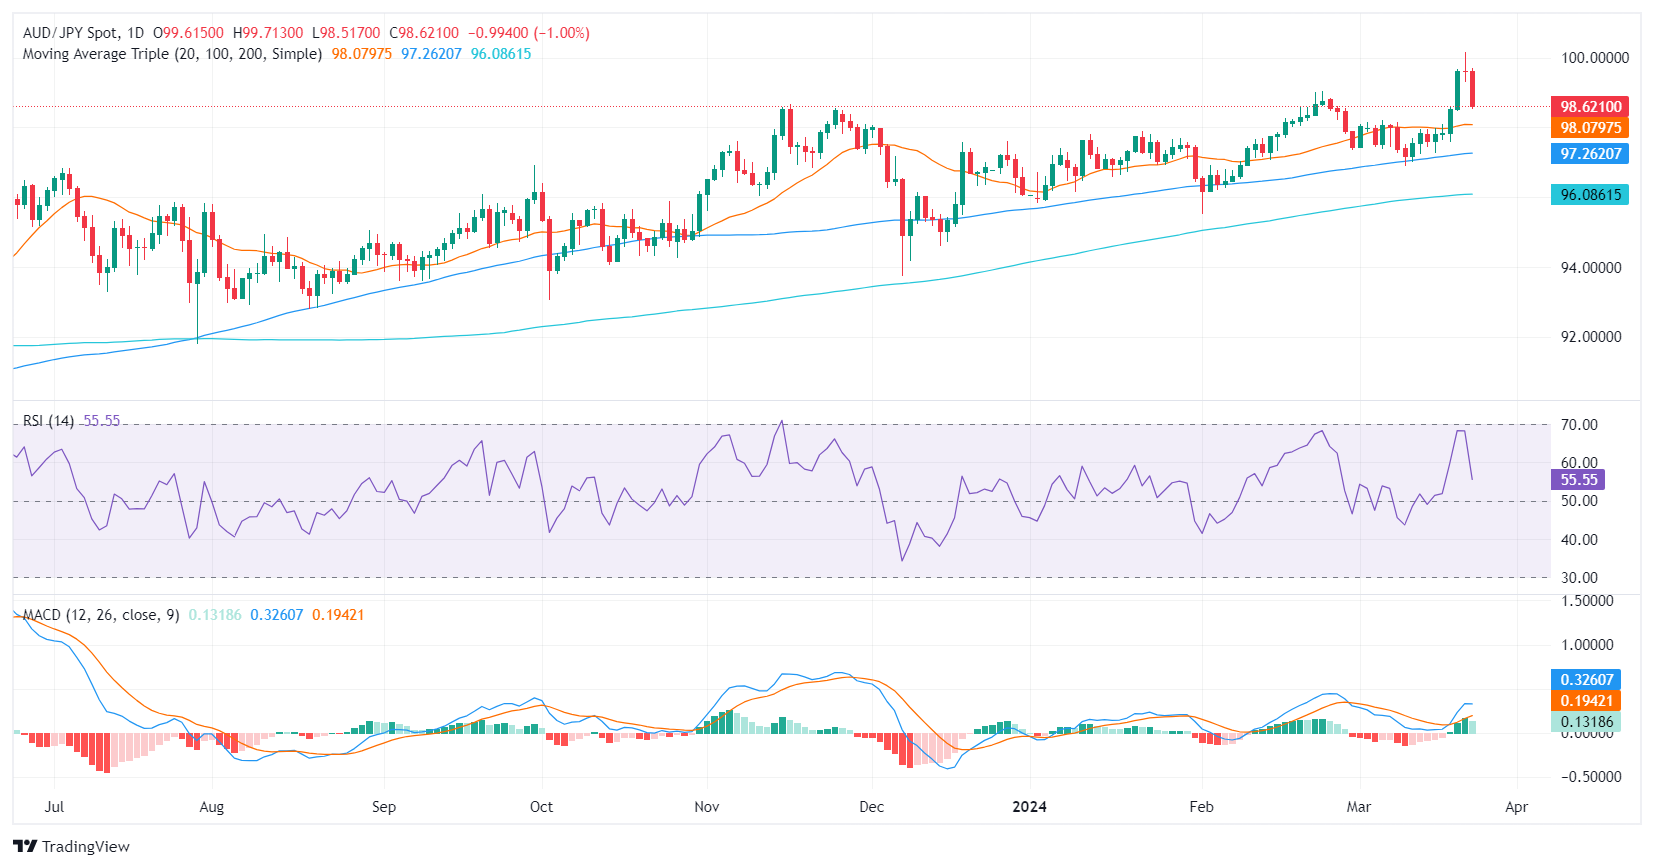
On the daily chart, the technical outlook for the AUD/JPY pair suggests a positive trend. The latest Relative Strength Index (RSI) reading resides in the positive territory, aligning with the recent upward momentum. Having peaked near overbought conditions earlier in the week, the RSI has now pulled back to a moderate level, pointing towards potential consolidation. Concurrently, the Moving Average Convergence Divergence (MACD) paints a contrasting picture, showing decreasing green bars that signify a slowdown in positive market momentum.
AUD/JPY daily chart
(Click on image to enlarge)
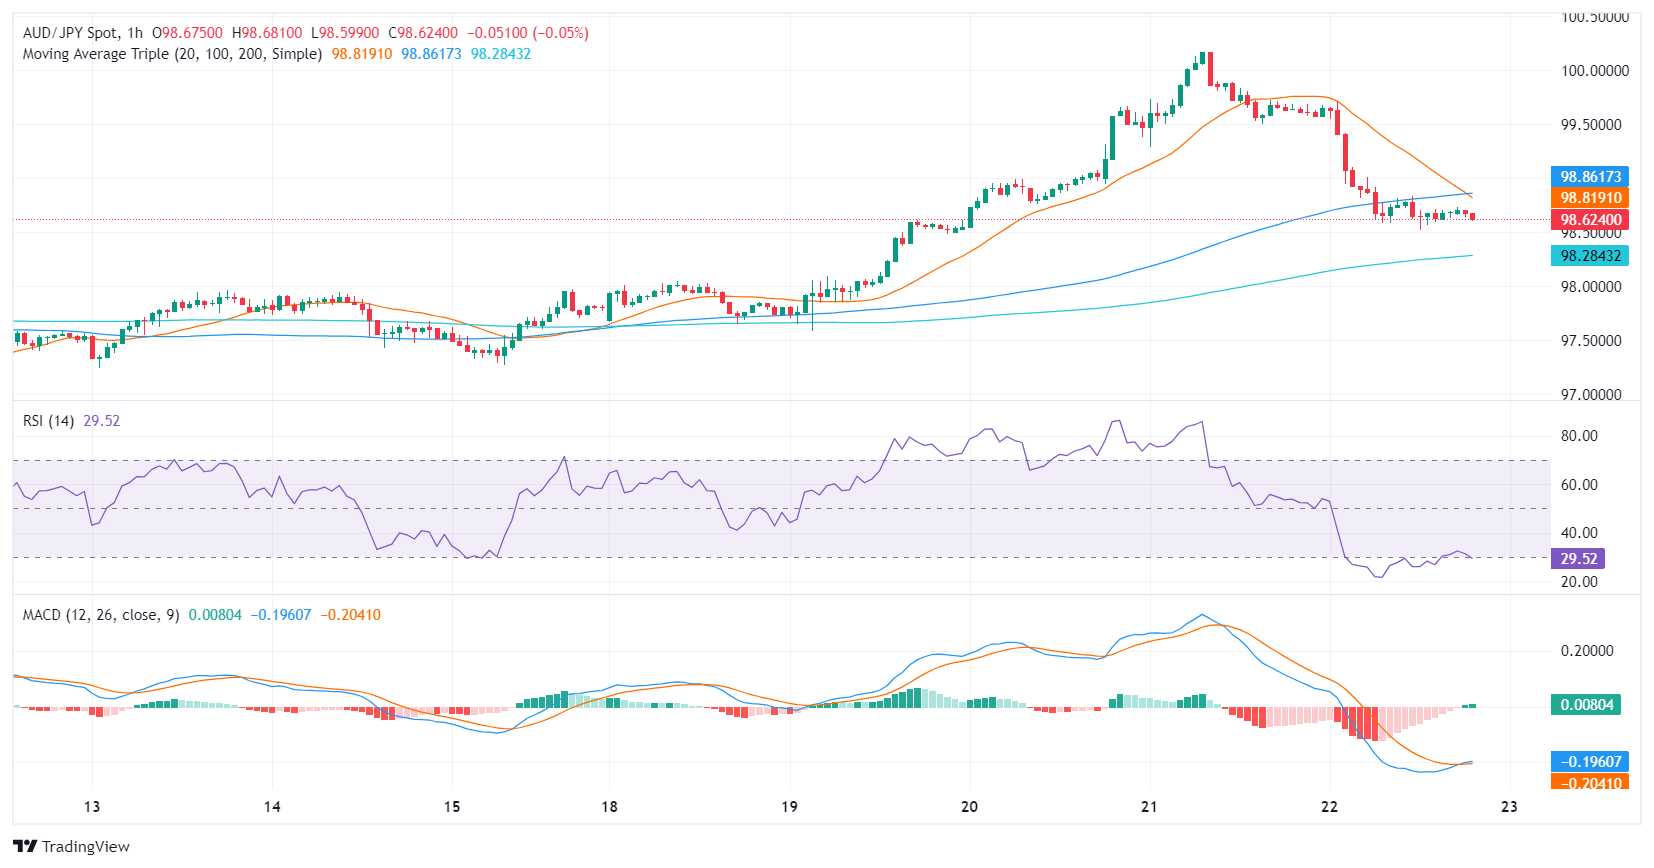
Switching to the hourly chart, the last session's RSI plunged deep into the oversold territory, which could hint at a potential short-term correction upwards. Despite the sharp drop in the RSI, the MACD histogram displays flat green bars, implying stagnating bullish momentum on hourly timeframes.
AUD/JPY hourly chart
(Click on image to enlarge)
The next target for the sellers is the 20-day Simple Moving Average (SMA) at 98.10. Below that the 100 and 200-day SMAs will act as strong supports in case the downside pressure persists but if the bulls defend this level, the overall trend will remain positive.
AUD/JPY
| OVERVIEW | |
|---|---|
| Today last price | 98.64 |
| Today Daily Change | -0.98 |
| Today Daily Change % | -0.98 |
| Today daily open | 99.62 |
| TRENDS | |
|---|---|
| Daily SMA20 | 98.09 |
| Daily SMA50 | 97.63 |
| Daily SMA100 | 97.25 |
| Daily SMA200 | 96.08 |
| LEVELS | |
|---|---|
| Previous Daily High | 100.17 |
| Previous Daily Low | 99.29 |
| Previous Weekly High | 97.97 |
| Previous Weekly Low | 96.9 |
| Previous Monthly High | 99.06 |
| Previous Monthly Low | 95.5 |
| Daily Fibonacci 38.2% | 99.63 |
| Daily Fibonacci 61.8% | 99.83 |
| Daily Pivot Point S1 | 99.21 |
| Daily Pivot Point S2 | 98.81 |
| Daily Pivot Point S3 | 98.33 |
| Daily Pivot Point R1 | 100.09 |
| Daily Pivot Point R2 | 100.57 |
| Daily Pivot Point R3 | 100.97 |
More By This Author:
USD/CHF Price Forecast: First Breakout Target MetEUR/JPY Price Analysis: Bearish Divergence Hints At Further Weakness
EUR/USD Tests 200-day Average With Key Central Bank Speakers Waiting In The Wings


Comments
Log in or sign up to join the conversation.