AUD/JPY: Buying The Dips At The Blue Box Area

Image Source: Pixabay
Here, we’re going to take a quick look at the Elliott Wave charts of the AUD/JPY pair. As our readers know, we’ve been favoring the long side in the AUD/JPY pair due to the incomplete bullish sequences the duo has been showing in the weekly cycle from the March 2020 low.
Consequently, we recommended readers to avoid selling the pair while favoring the long side. Recently, the AUD/JPY pair made a pullback that has given us good trading opportunities. We expected to find buyers at the extreme zone from the April 21 peak.
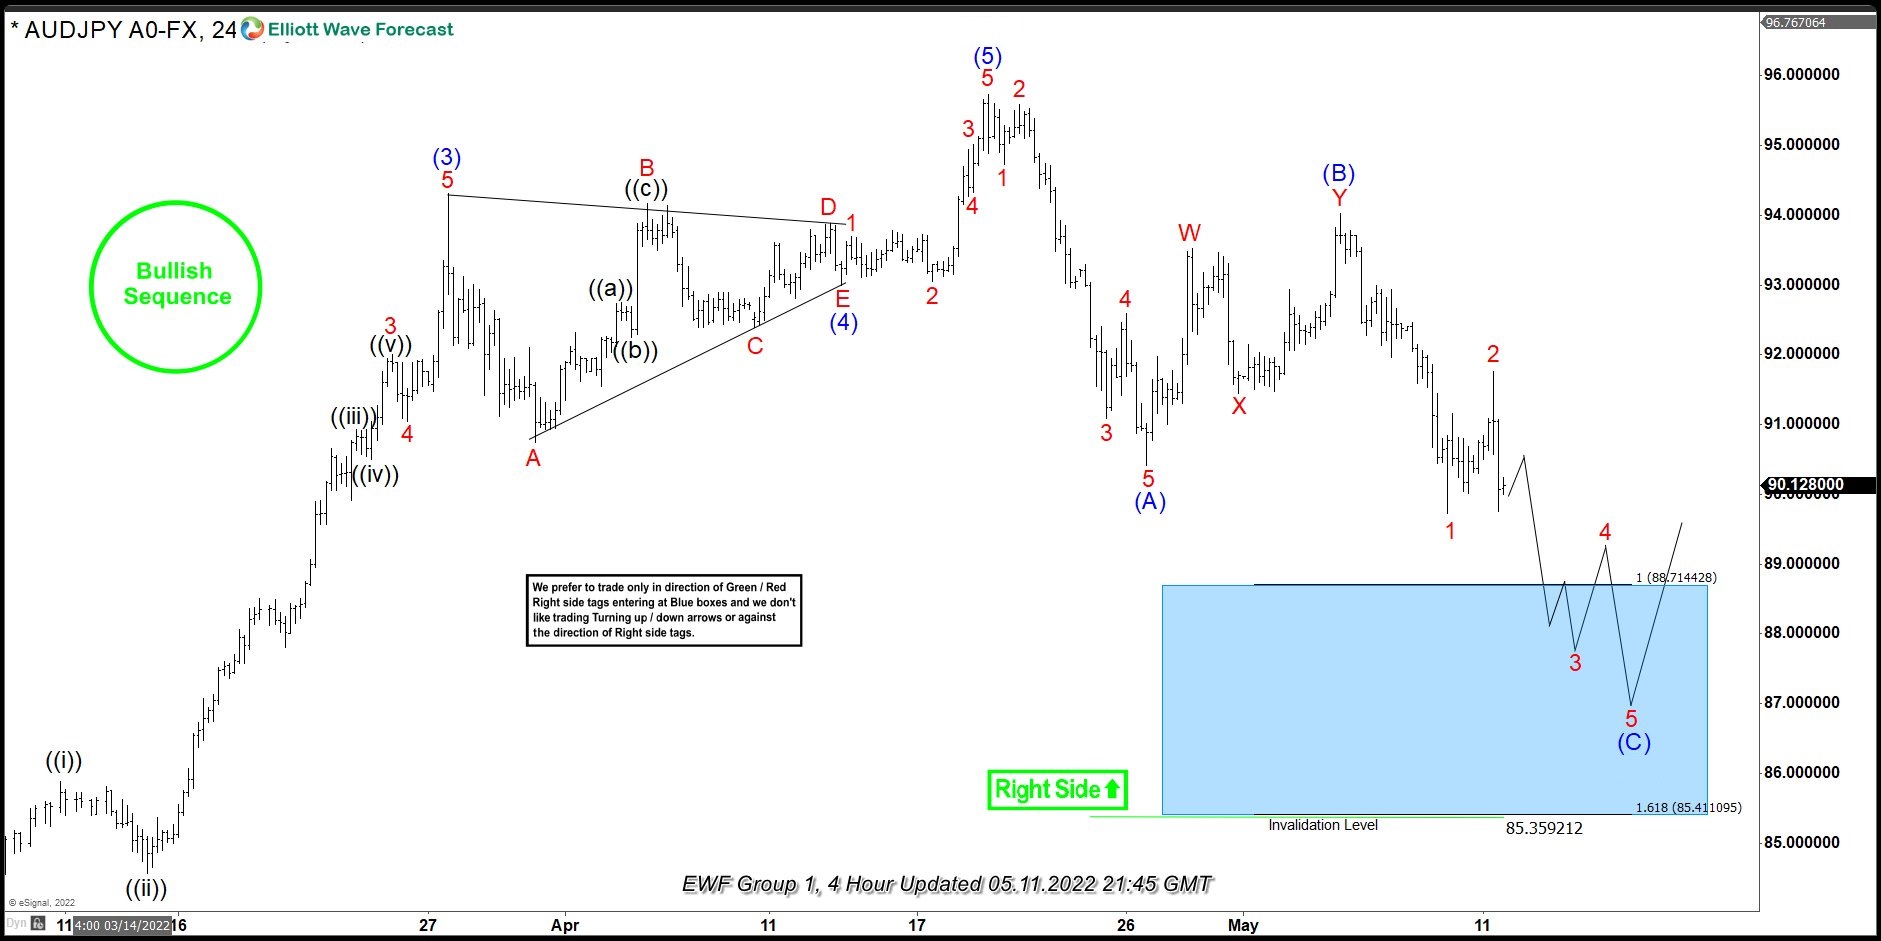
AUD/JPY Elliott Wave Four-Hour Chart for May 11, 2022
Our view suggests that the AUD/JPY pair was performing a pullback against the 78.77 low. However, this pullback was incomplete at the time. The first leg of the pullback looked like a 5-wave structure, which means the correction was seemingly forming an Elliott Wave zigzag pattern. We believe the (C) wave was still in progress toward the 88.71-85.41 area (blue box – buying zone).
We didn't recommend selling the pair against the main bullish trend. Our strategy is typically to wait for the price to reach the marked blue box zone before entering the long side again.
As the main trend was bullish, we expected buyers to appear at the blue box for a 3-wave bounce, at least. Once the bounce reached 50 Fibs against the (B) blue high, we would enter a long position without much risk. The trade would be invalidated with a break of the 85.41 level.
As our readers know, blue boxes are beneficial areas, often giving us an 85% chance to get a bounce.
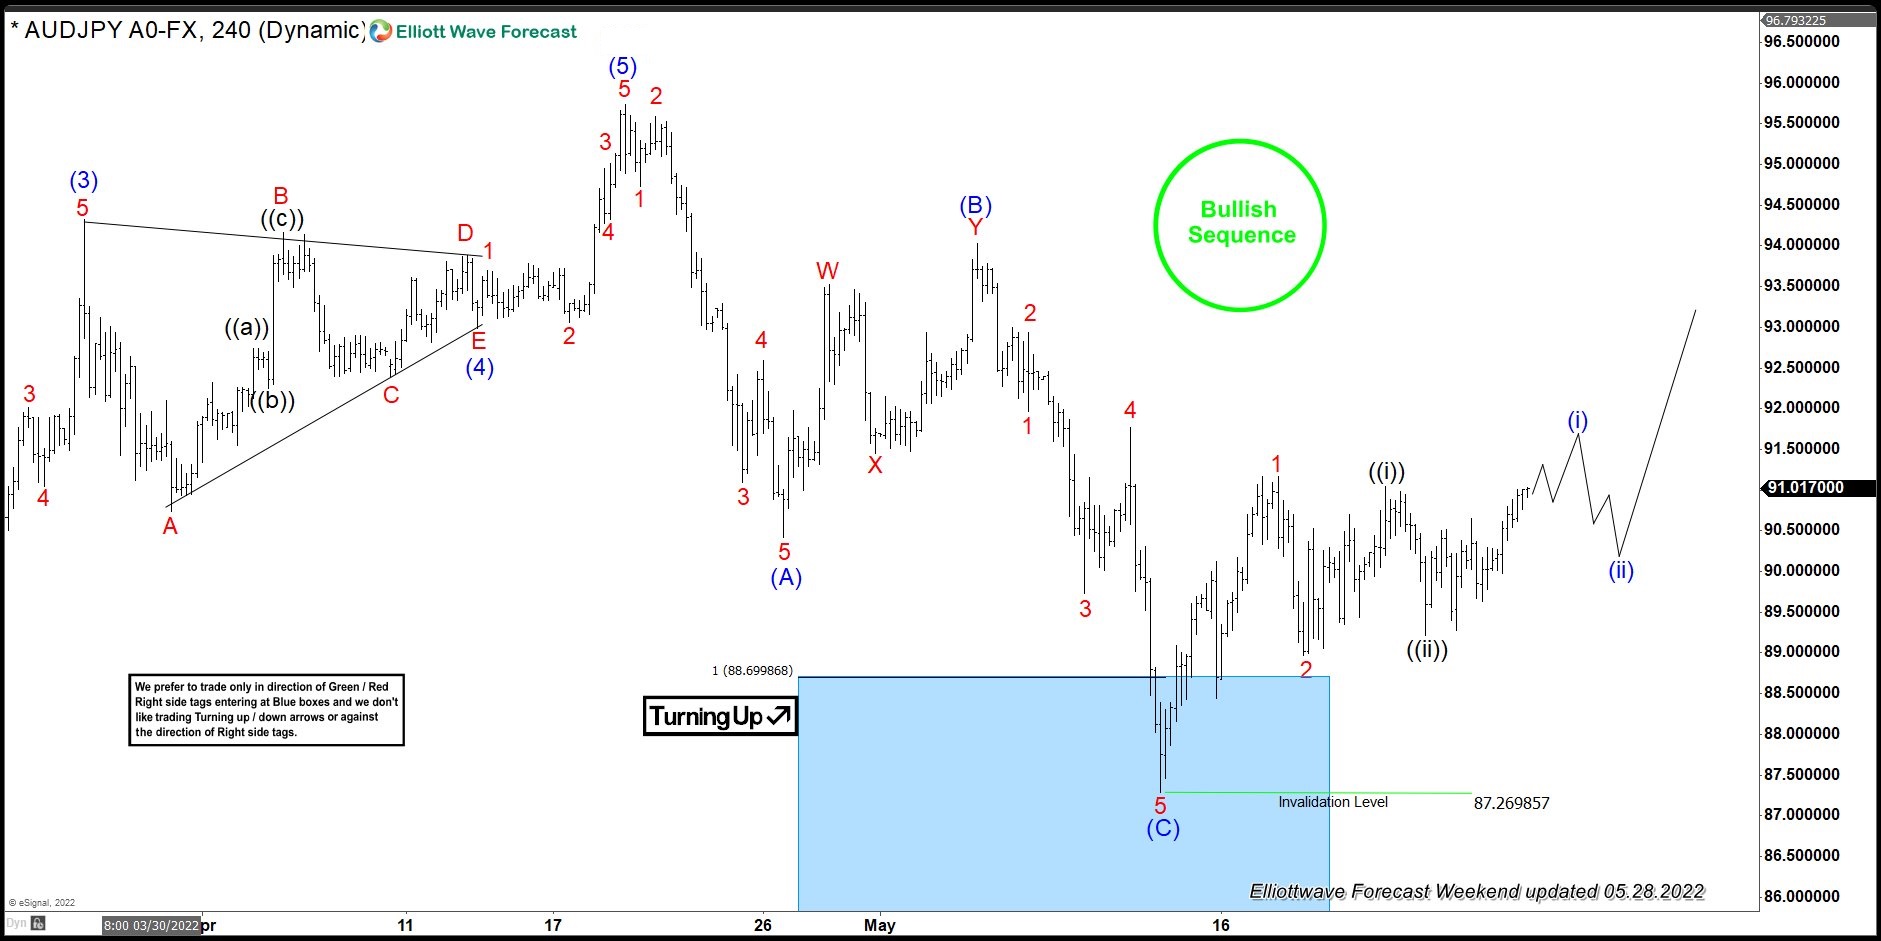
AUD/JPY Elliott Wave Four-Hour Chart for May 28, 2022
The AUD/JPY pair made a leg down, as expected. The pair found buyers at the blue box area, and we have been seeing a positive reaction from that point. The pullback appeared to have been completed at the 87.26 low. The rally from the blue box area reached 50 Fibs against the (B) connector.
Consequently, we booked partial profits and made low-risk trades. Now, we need to see break of April 21 peak in order to confirm that the next leg up is in progress. In the short-term, we would like to see a break above the red high of 91.16, which would open the possibility for further extension toward the 92.99-93.93 area.
Note: Some labeling have been removed in order to protect clients’ privileges.
You can learn more about Elliott Wave Zig Zag Patterns at our more


