

Image Source: Unsplash
AUDCAD has been in a bullish market since April 2025. From that low, it has rallied in a series of higher highs and higher lows, which is typical of bullish sequences. From an Elliott Wave perspective, this could easily be an impulse 5-wave structure. It’s also important to note that, prior to this bullish cycle, the pair had just completed a 4-year bearish cycle that corrected the larger bullish cycle from March 2020. Thus, it’s safe to say the cycle from April 2025 is a continuation of the March 2020 cycle. By projection, the pair is expected to extend much higher, to 1.010-1.11, in what could be a multi-month or even multi-year bullish cycle.
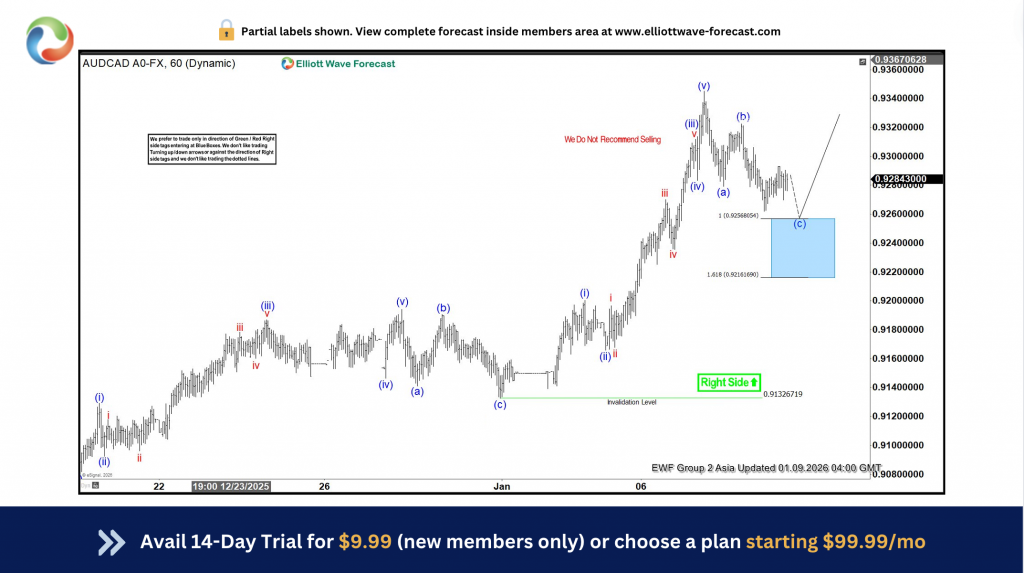
With this background established, we like to maintain the bullish bias on this currency pair. Thus, buying the dip is the way to go. As a result of this big rallies, we advised members against shorting the pair. Our charts show all the necessary information including the preferred wave count, path and right side. In a bullish market, we like to buy at the extreme of the pullback which we always indicate with our proprietary blue box zone.
AUDCAD Elliott Wave Analysis – 9th January, 2026 Update
Despite the prevailing trend, a significant pullback began on January 7th in the H1 timeframe. By the following day, the pullback showed corrective characteristics and presented a trading pattern we regularly utilize. On January 9th, we shared the H1 chart with members, highlighting the blue box. We anticipated the pullback to conclude at the blue box, providing members with an opportunity to go long in line with the established trend.
AUDCAD Elliott Wave Analysis – 12th January, 2026 Update

On January 12th (today), we shared the H1 chart with members. As anticipated, the pair reached the blue box, triggering members’ pending orders and moving higher. The move reached our initial target, allowing members to book some profit and adjust the remainder of their positions to break even. We anticipate further rallies in the coming days, potentially leading to a new January high. However, if the high is not broken and the price pulls back sharply, we will present members with another blue box, offering another opportunity to go long.
More By This Author:
Gold, Silver, And The S&P 500: Navigating The New CorrelationDAX Resumes Bullish Structure After Finding Support
Caterpillar Confirms Structural Nesting In The S&P 500 With Targets At 10,000


Comments
Log in or sign up to join the conversation.