An Israeli Home With A U.S. Twist
Our new research paper shows that Israeli investors have a greater home bias than other nations: they have invested more heavily in domestic equities and allocated to the U.S. in lower proportions than their developed markets peers such as the U.K., Europe and Canada.

With U.S. equities making up nearly 60% of the S&P Global BMI’s market capitalization, such allocations may be overlooking a sizeable portion of the global equity opportunity set. Adding some U.S. decor to a domestic Israeli equity allocation also historically provided higher return in both absolute and risk-adjusted terms, and could offer the potential for diversification.
U.S. Equities Have Outperformed Their Israeli Counterparts over Various Horizons
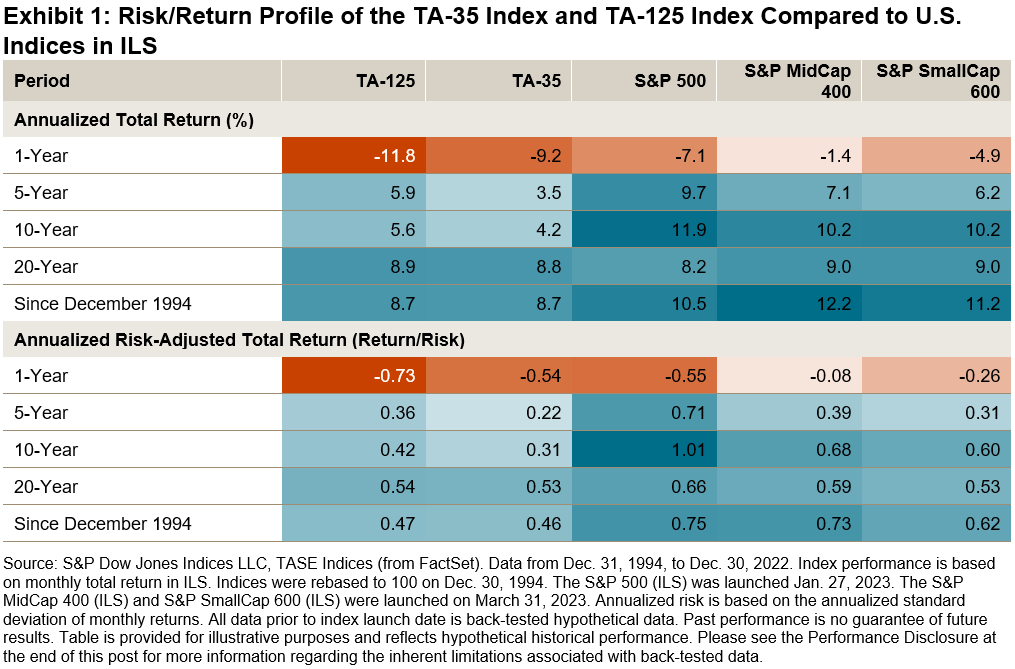
The S&P 500®, S&P MidCap 400® and S&P SmallCap 600® outperformed the Israeli equity market—as represented by the TA-125—by 15%, 11% and 9%, respectively, in Q1 2023 (all in ILS and total return terms). Exhibit 1 shows that this phenomenon is not just a recent one: U.S. equities have outperformed their Israeli counterparts over short-, medium- and long-term horizons in both absolute and risk-adjusted terms. Similar results are observed for USD-denominated versions of the indices.

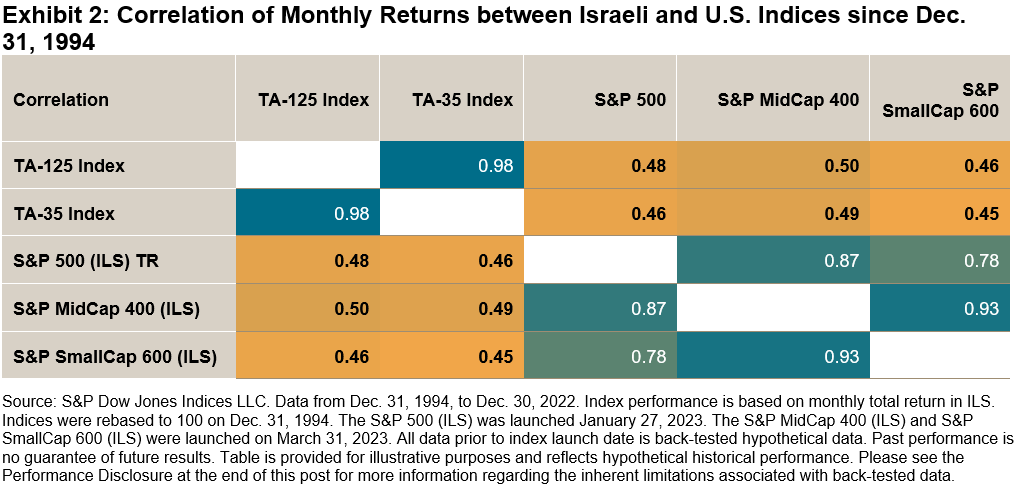
Looking at the correlation of U.S. equities with the TA-125 and blue-chip TA-35 in Exhibit 2 we can see that all of the S&P Composite 1500®’s component indices had a correlation of less than 0.5 (based on monthly returns since Dec. 31, 1994). This suggests an opportunity for U.S. equities to act as a diversifier when incorporated into Israeli equity allocations.

Despite recent spikes in 3-year rolling correlation, compared to correlations over the last 28 years, U.S. and Israeli equities are not perfectly correlated (equal to 1), which means there is still opportunity for diversification. In recent times, that opportunity has increased, with U.S. and Israeli equities continuing to decouple from their 2020 coronavirus correlation highs.

The outperformance of U.S. equities, and their lower long-run correlations with Israeli equities since December 1994, has meant that adding U.S. equities to an Israeli equity allocation could have improved returns, with lower volatility. Exhibit 4a shows the annualized return and volatility figures for various hypothetical combinations of the S&P 500, S&P MidCap 400 and S&P SmallCap 600 with the TA-125, starting with a 100% Israeli allocation and moving in 10% increments to a 100% U.S. equity allocation. Each hypothetical portfolio rebalances back to the target weights at the end of each quarter.


In addition to the potential performance and diversification benefits, incorporating U.S. equities may help Israeli investors to alleviate domestic sector biases. Compared to the S&P 500, Israeli equity indices like the TA-125 and TA-35 are heavily overweight Financials and Real Estate, while underweighting Information Technology by 11%, as shown in Exhibit 4b. The S&P 500’s largest constituents include some of the world’s most well-known “big tech” companies, such as Apple and Microsoft.

While U.S. equities are not the only way to seek diversification, investors may wish to evaluate their U.S. equity exposure in order to avoid overlooking a sizeable portion of the global opportunity set. A simple flourish of U.S. equities may not be enough to decorate a home, and so one may want to consider a real twist to measure the full potential of U.S. equities across capitalization ranges, especially as smaller U.S. equity segments are as large as other countries’ stock markets.
More By This Author:
Diversification And Performance: Potential Applications Of U.S. Equities In JapanThe “Devil’s Metal” Vanishes, Precious Metals Shine And Energy Dims: Commodities Quarterly Wrap
Exploring The Path To Net Zero In China’s Greater Bay Area
Disclaimer: See the full disclaimer for S&P Dow Jones Indices here.


