
Five Powerful Reversal Patterns Every Trader Must Know

In this post, we will discuss five powerful and reliable reversal patterns in the forex market. Generally, reversal patterns provide a great Risk-Reward ratio potential. We will learn how to identify each one of them and how to trade by using these patterns.
Head & Shoulders Pattern
The Head & Shoulders pattern is a very unique reversal pattern. It’s a chart formation created by three peaks of the price. The two peaks on the sides are usually on the same height or close and the one in the middle is the highest.
The Head & Shoulders pattern consider as one of the most powerful reversal patterns in the forex market. This pattern got the name because it actually reminds a head with two shoulders on the sides. Usually, we will look for this pattern and use it after a significant uptrend, or an opposite Head & Shoulders after a downtrend.
In a bullish trend, the price creates a top – it will be the left shoulders. Then, after technical correction, the price creates a higher top – that will be the head. Now the price will form a deep technical correction to the same level as the last low.
And lastly, the price creates a lower high which is the right shoulder. The line that connects all the three bottoms of the three peaks called the Neckline. The confirmation of the pattern comes after the price breaks the Neckline. The moment the price breaks the Neckline consider as a reversal signal and that’s the time to look for sell position.
Or to look for a buy position in the opposite Head & Shoulders after a downtrend.
Examples:
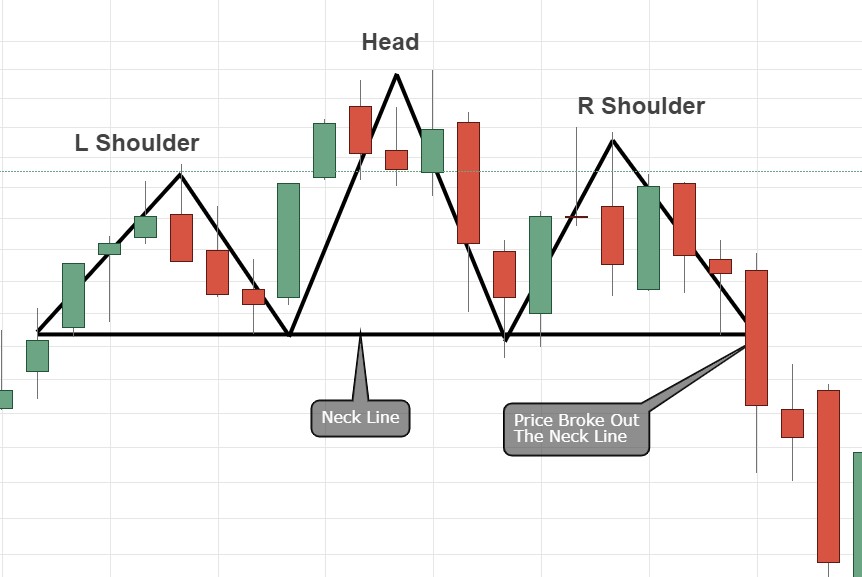
Bearish reversal Head & Shoulders
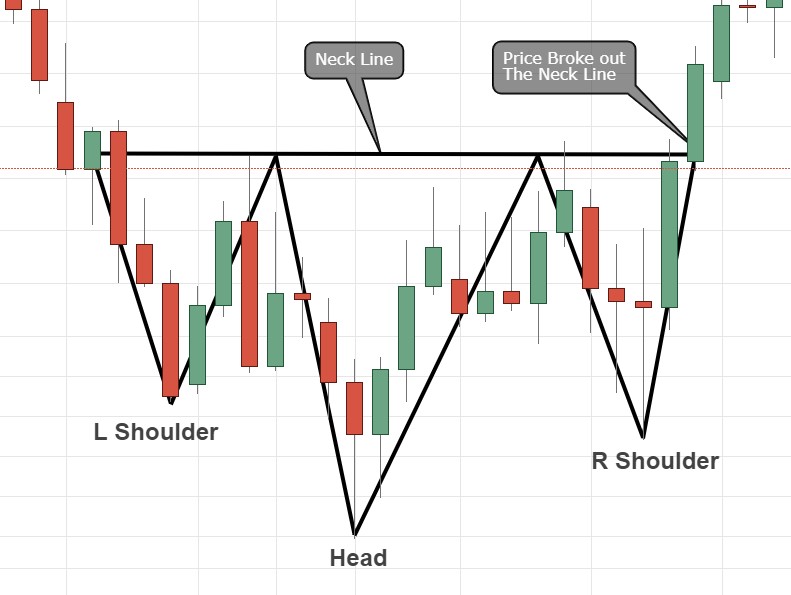
Bullish reversal Head & Shoulders
Double Top and Bottom
The double top and double bottom are both a reversal chart pattern.
The double top pattern will usually occur and be useful after a significant uptrend. In an uptrend, the price always creates higher peaks and higher lows.
The double top pattern is formed by two peaks at the same heights. the situation of two peaks at the same heights after an uptrend indicates the buyers are running out of power.
The last bottom between the two tops called the trigger line.
The pattern will be completed only when the price breakout the trigger line. when the price breakout the trigger line it’s a signal for us to look at a price action setup for sell position.
The double bottom is the exact opposite of the double top pattern. It will usually be reliable and useful after a significant downtrend of the price.
In a downtrend, the price creates lower bottoms and lower heights.
In the double bottom pattern, the price creates two bottom at the same level and the sellers failed to create a new lower bottom. that indicates the sellers running out of power and reversal opportunity might appear very soon.
The pattern will be completed when the price will break out the trigger line which is the last top between the two bottoms.
When that happens we should look for a buy position.
Examples:
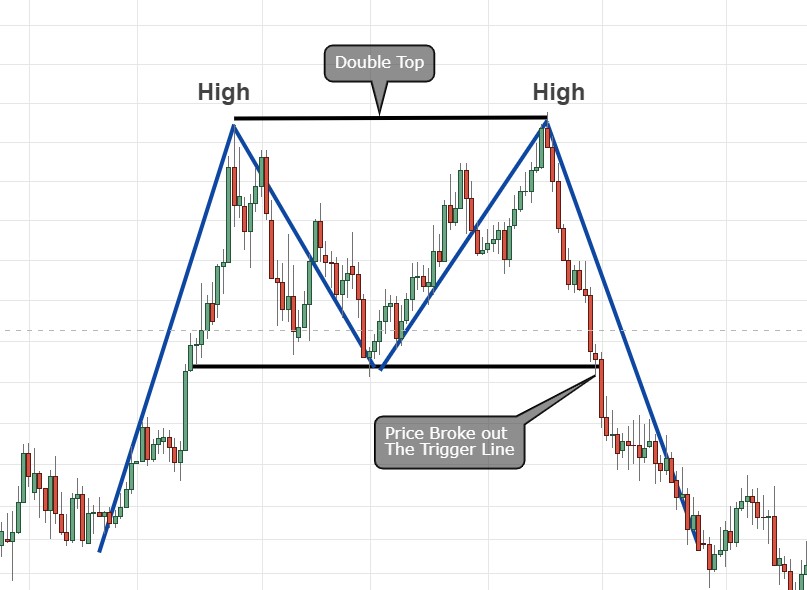
Double top pattern
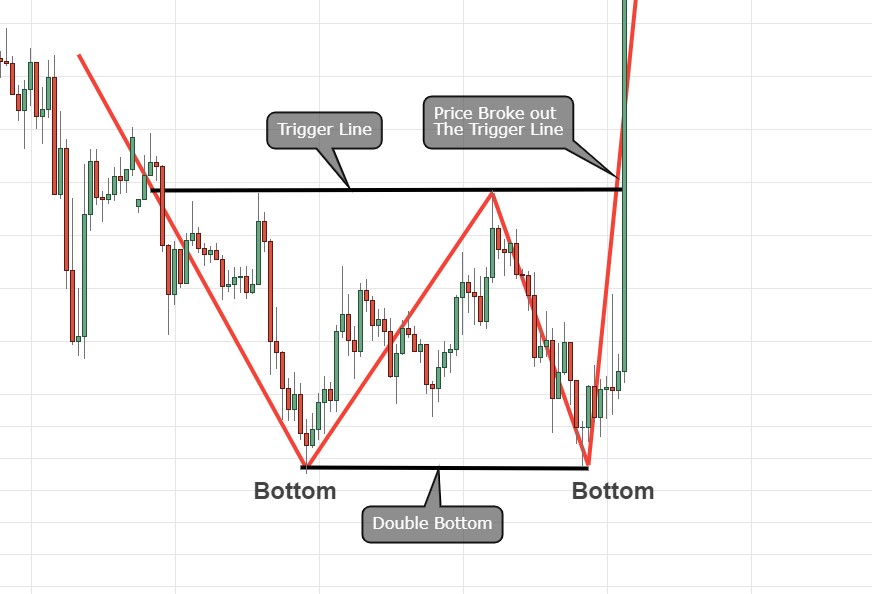
Double bottom pattern
Quasimodo Pattern
Definitely, Quasimodo is one of the most reliable and powerful chart patterns to identify reversal opportunity.
Relatively, the Quasimodo pattern is a new one among technical analysis forex traders. same as the previous patterns we mentioned Quasimodo is more reliable and powerful if it occurs after a significant uptrend or downtrend.
The structure of the Quasimodo pattern is quite simple.
Uptrend – the price creates higher peaks and higher lows. then, from the last peak, the price dropped down to form a new lower low. a new lower low indicates the momentum has changed from bullish to bearish.
Usually, the entry-level will be the last peak of the price.
Downtrend – The price creates lower lows and lower peaks. then, from the last bottom the price rallies and creates a new higher high. this new higher high after a few lower highs indicates the momentum changed from bearish to bullish.
The entry-level, in that case, will be the last bottom where the price rallies from.
The Quasimodo pattern is a great pattern to trade it since it creates a great Risk-Reward potential.
Examples:
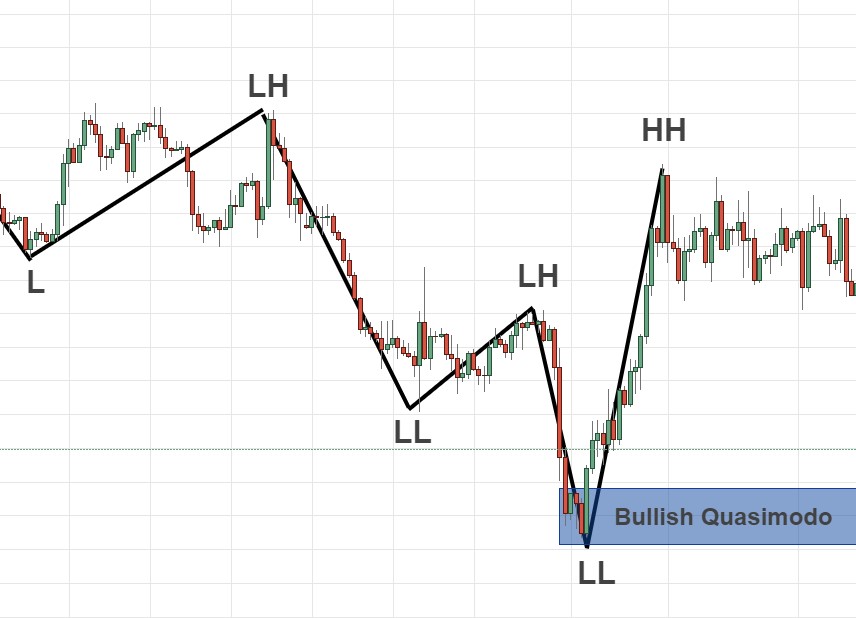
Bullish Quasimodo
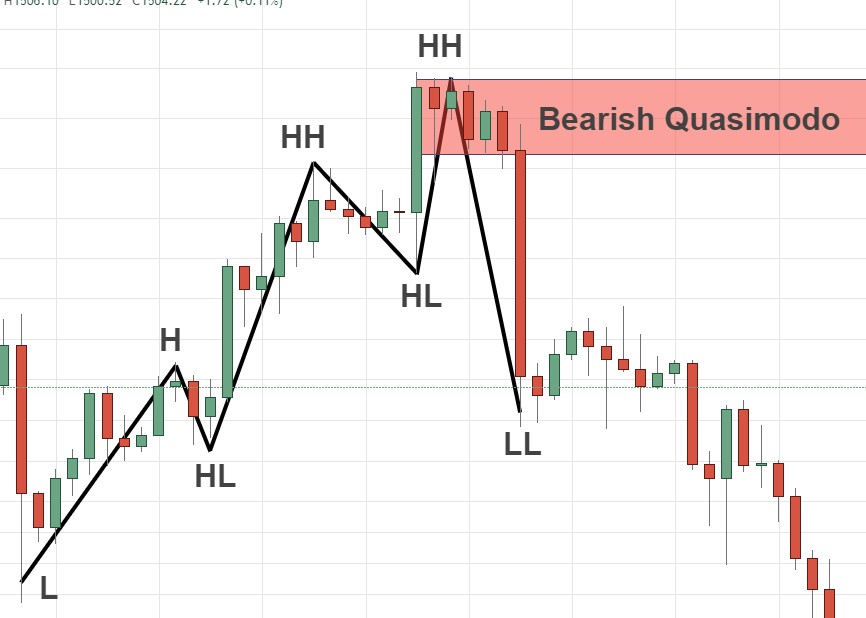
Bearish Quasimodo
Engulfing Candlestick Pattern
The engulfing candlestick pattern is a reversal pattern which forms by two candles. the bullish engulfing pattern shows up after a downtrend.
It starts with one bearish candle followed by a large bullish candle that engulfing the bearish candle. the bullish engulfing candle must close above the previous candle’s high.
That indicates the buyers are waking up and we should look for a price action setup for buy position.
A bearish engulfing candlestick pattern will show up after an uptrend. the first candle in this formation will be a bullish candle and the second is the bearish candle which engulfing the bullish one.
The bearish engulfing candle must close below the previous candle’s low.
When this formation occurs we should start to look for a price action setup for sell position.
Finding bearish or bullish engulfing candlestick pattern at support/resistance levels makes it much more powerful and reliable.
Examples:
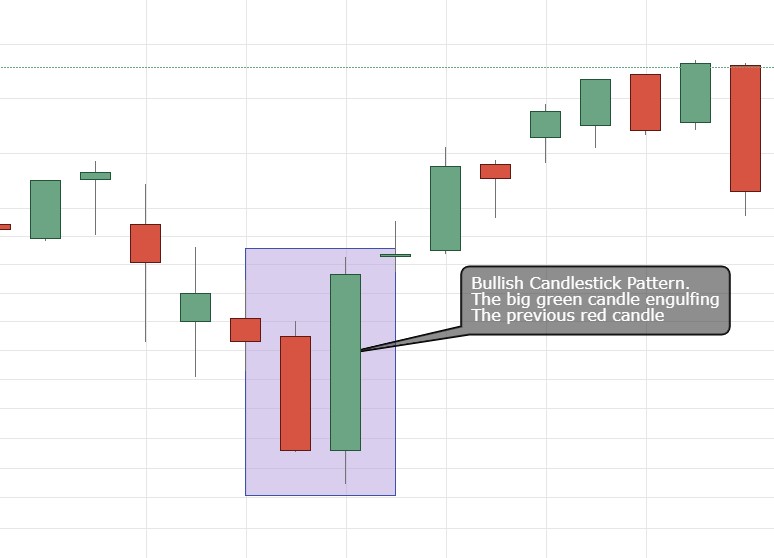
Bullish engulfing candle
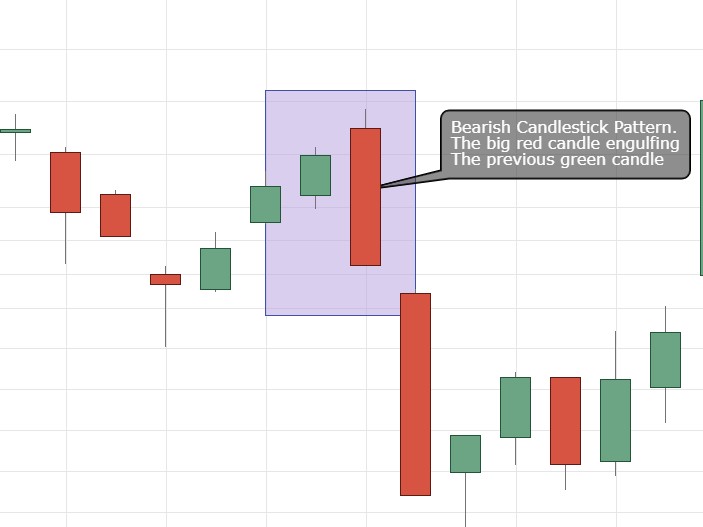
Bearish engulfing candle
Pin Bar Candlestick
The Pin Bar candlestick pattern is one candle formation. this candlestick pattern considers as a reversal pattern among forex traders.
It also considers as one of the most powerful and reliable candlestick patterns for trading.
The structure of a bullish pin bar starts with a long tail at the bottom, which called also “wick”. the tail should be at least 2/3 of the entire candle size.
Then, a small body which is the area between the open and closed price. and in some of them also a small tail at the top.
When we get this type of formation after a significant downtrend it indicates of reversal opportunity to become soon. In that case, we should start to look for a price action setup for buy position.
The structure of a bearish Pin Bar is the exact opposite, start with a long tail at the top. then, a small body, and a small tail at the bottom for some of them.
When a bearish Pin Bar candlestick pattern occurs after a significant uptrend we should start looking for a price action setup for sell position.
Examples:
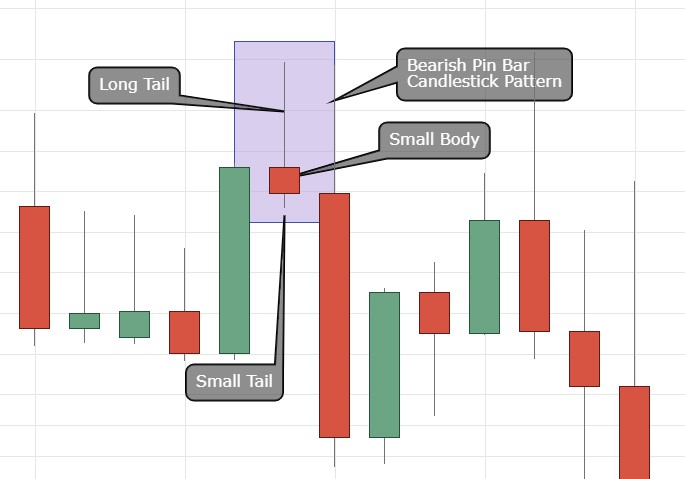
Bearish pin bar
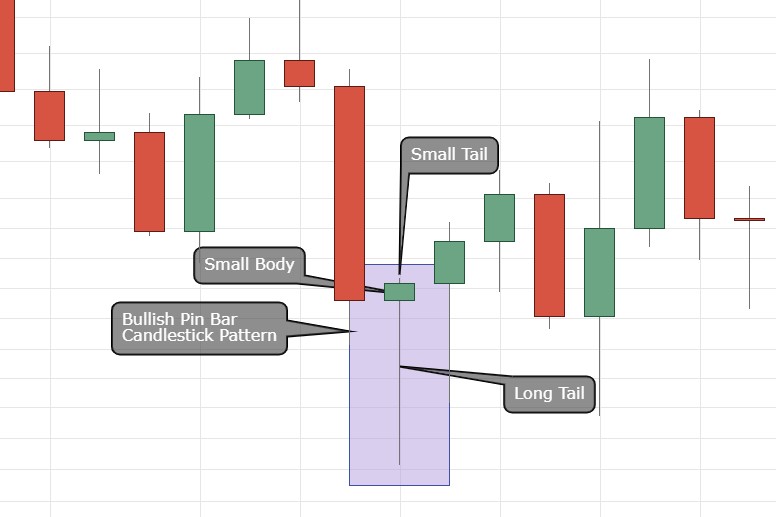
Bullish pin bar


