
Before we all get too excited, bear in mind that this is November's data - so still horribly stale (and also missing October's data point entirely) - but it's all we have for now, so let's dive in...
The Fed's favorite inflation indicator - Core PCE - rose 0.2% MoM (as expected), which leave it up 2.8% YoY (as expected), slightly lower than September's +2.9%...
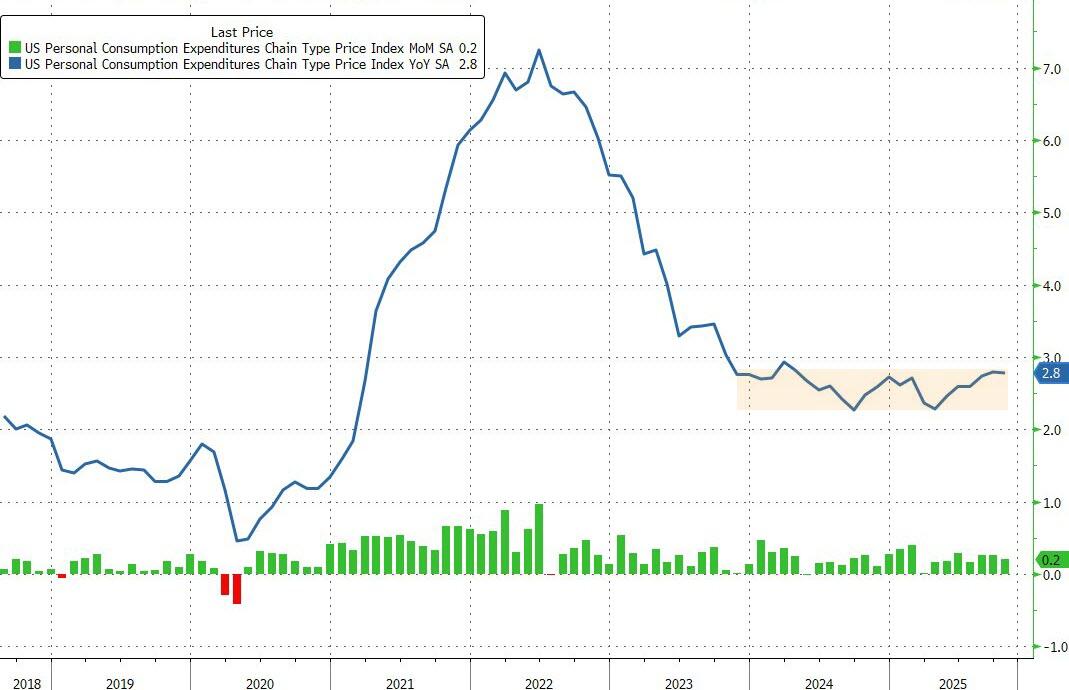
Source: Bloomberg
Bear in mind that this morning's third look at Q3 GDP printed a +2.9% YoY for Core PCE.
Under the hood, the biggest driver of Core PCE remains Services costs - not tariff-driven Goods prices...
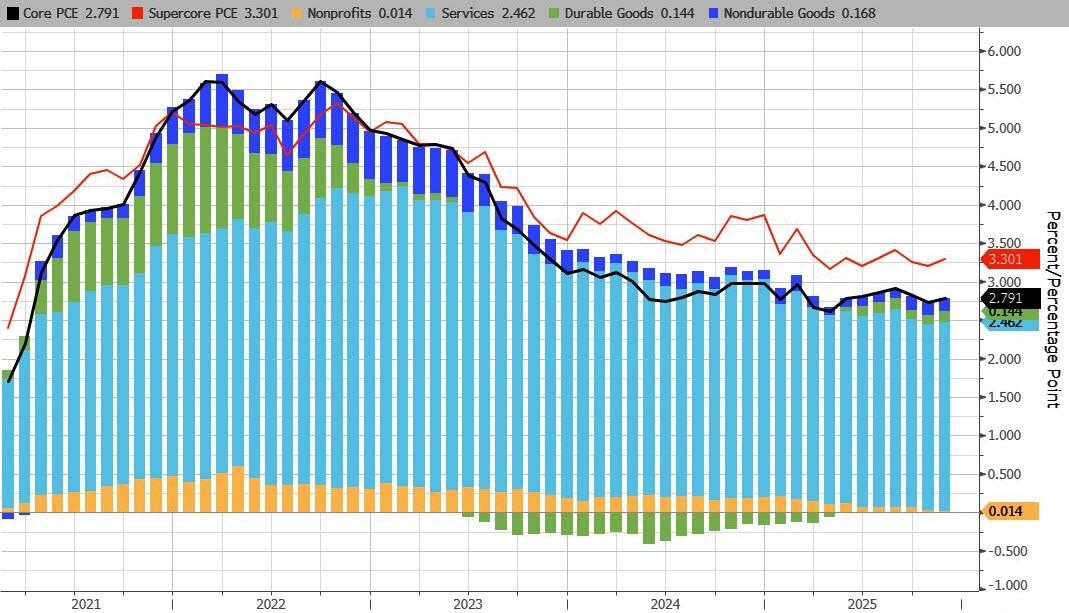
Source: Bloomberg
In fact, on a MoM basis, Non-durable goods prices saw deflation for the second month in a row...
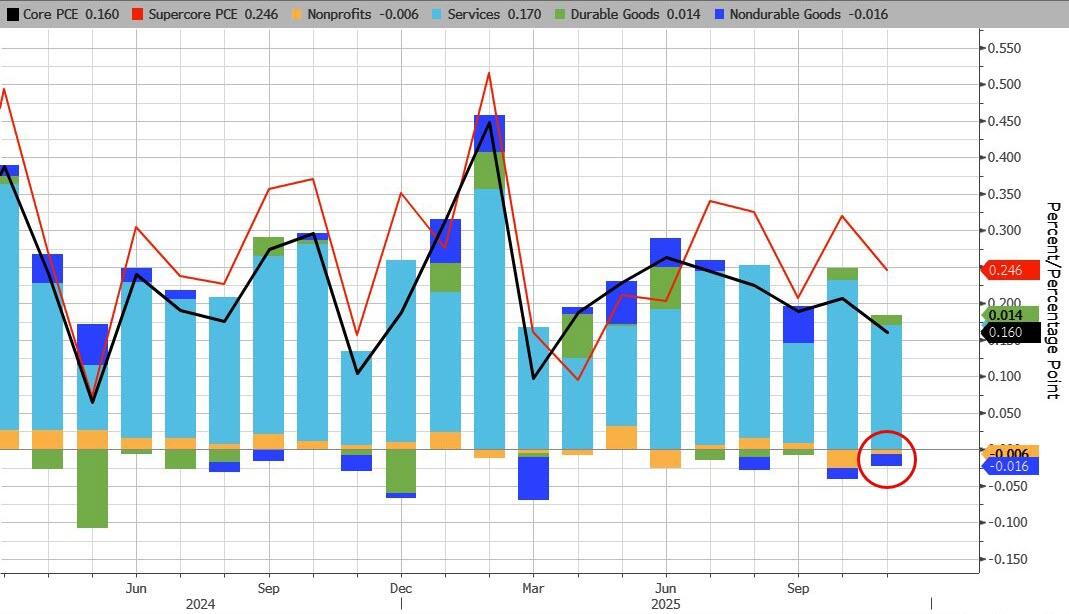
Source: Bloomberg
Headline PCE rose 2.8% YoY (es expected), stubbornly refusing to show any signs of runaway Trump tariff costs...
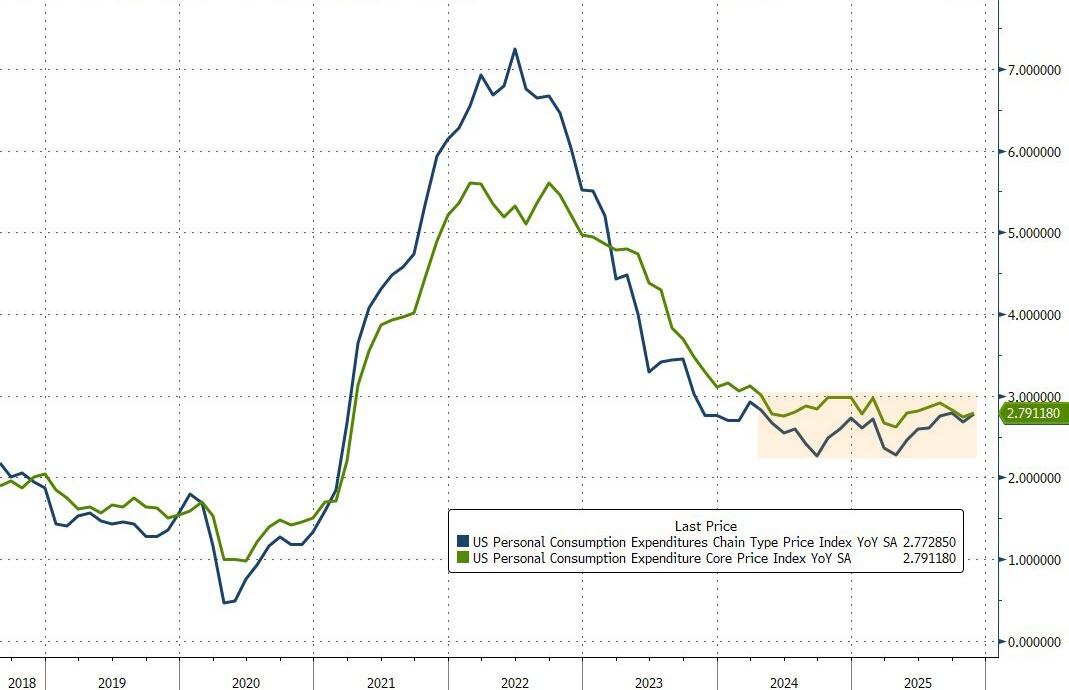
Source: Bloomberg
The closely-watched SuperCore PCE rose 0.2% MoM which ticked up the YoY rise to 3.1%...
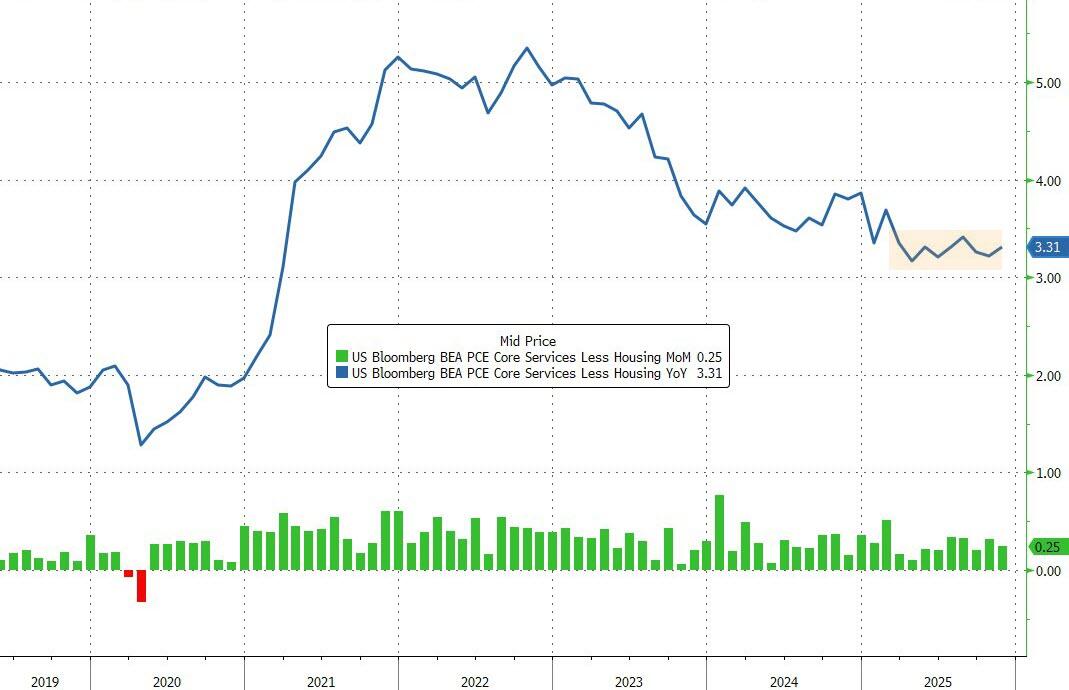
Source: Bloomberg
After surging in October, November saw Financial Services & Insurance and Healthcare cost inflation slow...
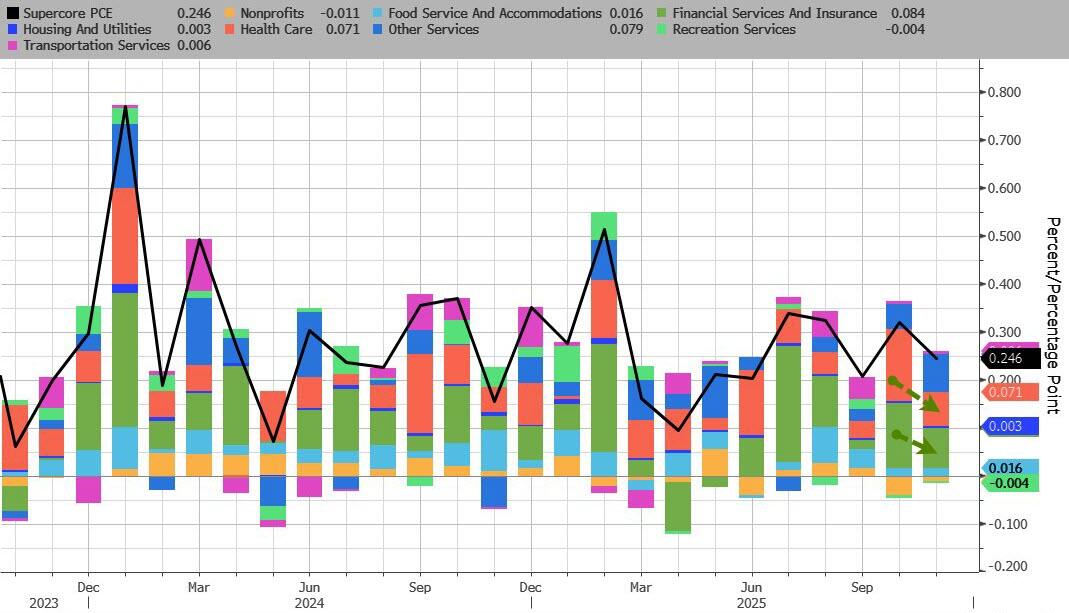
Source: Bloomberg
Meanwhile, amid rising prices, Americans' spending outpaced incomes once again...
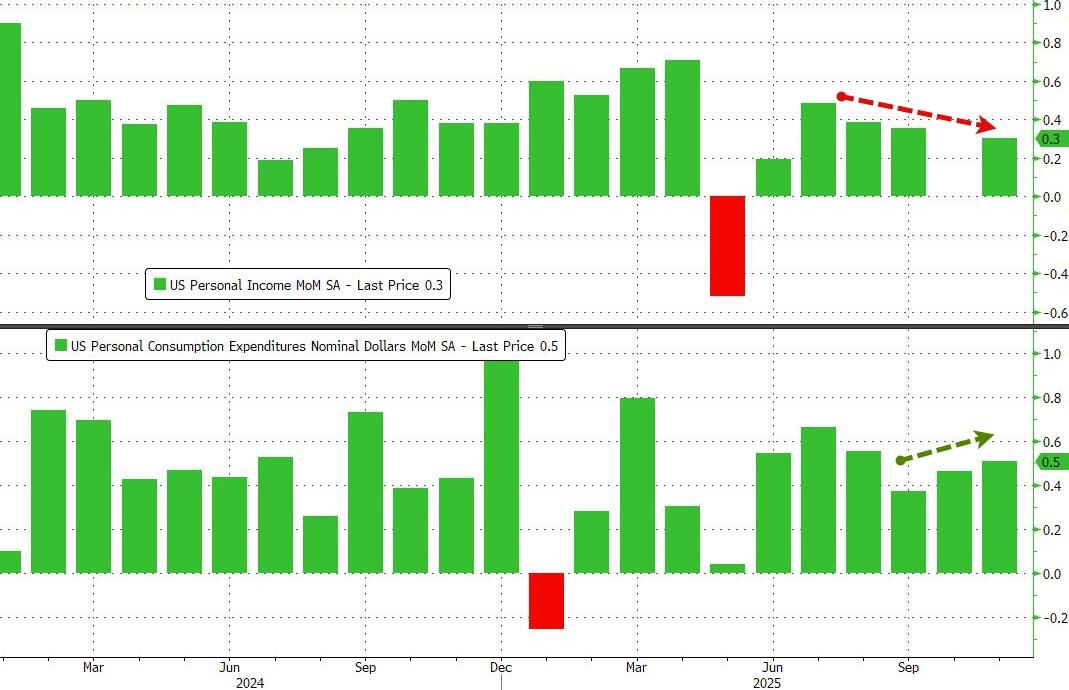
Source: Bloomberg
...with wage growth slowing for all:
-
Private worker wages and salaries: 4.1% YoY, down from 4.5%, lowest since June 2025
-
Govt work wages and salaries 2.6%, tied for lowest since March 2021

All of which dragged the savings rate down to its lowest since Nov 2022...

TL/DR: While this data is admittedly stale, it shows no signs of 1) tariff-driven inflation or 2) a slowing consumer.
More By This Author:
Stellar 20Y Auction Stops Through With Near Record Bid To Cover, Record DirectsLululemon Yanks Leggings Over "See-Through" Concerns When Bending Over
Netflix Craters On Disappointing Guidance, Stock Buyback Pause


Comments
Log in or sign up to join the conversation.