

Image source: Wikipedia
Similar to the Scarecrow in The Wizard of Oz offering Dorothy two contradictory paths to the Emerald City, last week’s Consumer Price Index (CPI) and Producer Price Index (PPI) data provided conflicting signals, implying the Federal Open Market Committee (FOMC) might adopt a more cautious stance on lowering interest rates.
As a result, investors were left pulling petals from a daisy, wondering whether the FOMC will cut rates or won’t cut rates at each of its remaining meetings for 2025. Not surprisingly, some sectors, subindustries, and stocks that skyrocketed when optimism surged following the encouraging CPI report were subsequently trashed when the PPI report told a different story.
Recent data has contributed to the confusion, as Friday’s retail sales beat estimates after big upward revisions in May and June. However, consumer sentiment and industrial production reports showed subsiding consumer optimism, as well as weaker output for all factories, mines, and utilities.
We expect July Personal Consumption Expenditures (PCE) chain price gains of 0.2% for the headline and 0.3% for the core, which would match the respective June CPI gains. We also expect a Q2 GDP growth boost to 3.1% from 3% and forecast 2% GDP growth in Q3 and 1.9% in Q4. Even though the inflation picture has become a bit murkier, CFRA still expects the FOMC to cut rates by 25 basis points at both its September and December meetings, while skipping action in October.
Despite the whipsaw action, the S&P 500 eked out a 0.9% rise in the week ending Aug. 15, accompanied by gains for all sizes and styles, along with eight of 11 sectors. Separately, news of Warren Buffett’s purchase of battered UnitedHealth Group Inc. (UNH) sent bargain hunters in search of other potentially oversold opportunities – by looking for groups or stocks trading at an RSI (Relative Strength Index, a measure of price momentum) of 30 or below, which indicates an oversold condition with the likelihood of a near-term turnaround. This contrasts with an RSI of 70 and above, which implies overbought and due for a pause.
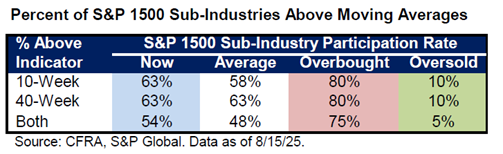
Finally, last week saw a continued uptick in the week-ending percentage of the 155 sub-industries in the S&P 1,500 trading above their 10-week and 40-week moving averages – as well as above both to 54% – after registering an oversold reading of 7% on Apr. 4.
More By This Author:
FRT: A Retail REIT Targeting Markets With Strong DemographicsVNT: A New "Buy" In The Industrial Tech Space
ORLY: A Cannibal Stock That You Should Consider


Comments
Log in or sign up to join the conversation.