Existing-Home Sales: Second Highest YoY Increase On Record
This morning's release of the June Existing-Home Sales showed that sales rose to a seasonally adjusted annual rate of 5.86 million units from the previous month's 5.78 million. The Investing.com consensus was for 5.9 million. The latest number represents a 1.4% increase from the previous month and a 24% increase YoY.
Here is an excerpt from today's report from the National Association of Realtors.
WASHINGTON (July 22, 2021) – Existing-home sales increased in June, snapping four consecutive months of declines, according to the National Association of Realtors®. Three of the four major U.S. regions registered small month-over-month gains, while the fourth remained flat. However, all four areas notched double-digit year-over-year gains.
Total existing-home sales,1 https://www.nar.realtor/existing-home-sales, completed transactions that include single-family homes, townhomes, condominiums and co-ops, grew 1.4% from May to a seasonally adjusted annual rate of 5.86 million in June. Sales climbed year-over-year, up 22.9% from a year ago (4.77 million in June 2020).
"Supply has modestly improved in recent months due to more housing starts and existing homeowners listing their homes, all of which has resulted in an uptick in sales," said Lawrence Yun, NAR's chief economist. "Home sales continue to run at a pace above the rate seen before the pandemic."
"At a broad level, home prices are in no danger of a decline due to tight inventory conditions, but I do expect prices to appreciate at a slower pace by the end of the year," Yun said. "Ideally, the costs for a home would rise roughly in line with income growth, which is likely to happen in 2022 as more listings and new construction become available." [Full Report]
For a longer-term perspective, here is a snapshot of the data series, which comes from the National Association of Realtors. The data since January 1999 was previously available in the St. Louis Fed's FRED repository and is now only available for the last twelve months.
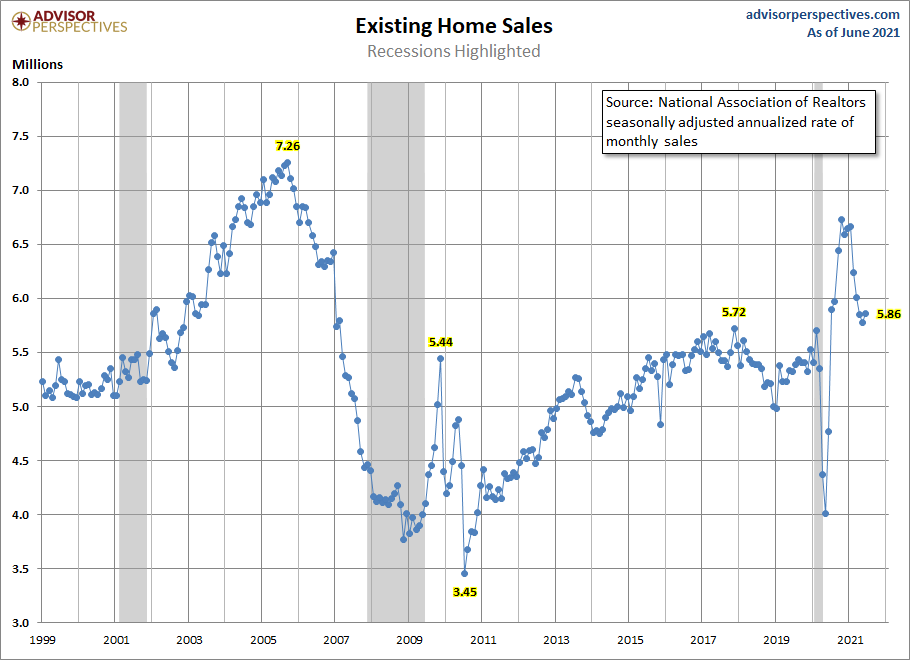
Over this time frame, we clearly see the Real Estate Bubble, which peaked in 2005 and then fell dramatically. Sales were volatile for the first year or so following the Great Recession.
The Population-Adjusted Reality
Now let's examine the data with a simple population adjustment. The Census Bureau's mid-month population estimates show a 19.2% increase in the US population since the turn of the century. The snapshot below is an overlay of the NAR's annualized estimates with a population-adjusted version.
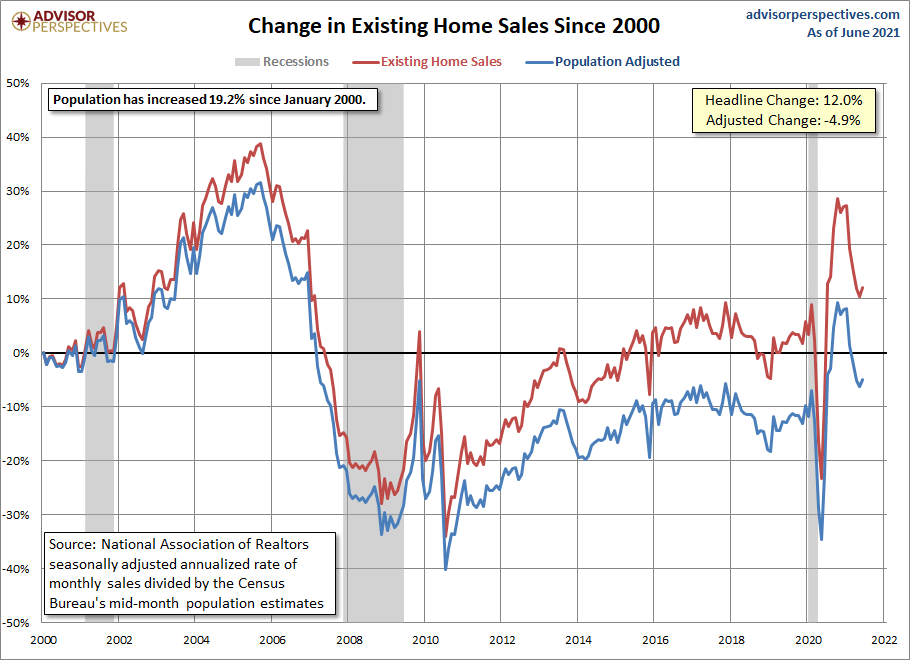
Existing-home sales are 12% above the NAR's January 2000 estimate. The population-adjusted version is 4.9% below the turn-of-the-century sales.
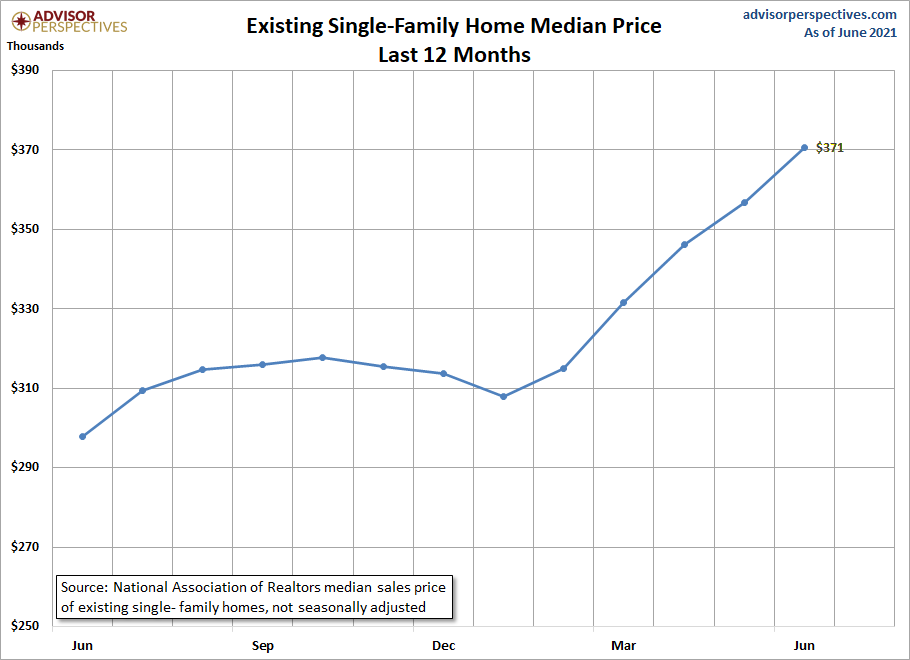
Existing-Home Sales Median Prices for Single Family Homes
We've added a chart for the last 12 months of Existing-home sales median prices for single-family homes for reference.