

Image Source: Pexels
Friday's release of the October Existing-Home Sales showed that sales fell to a seasonally adjusted annual rate of 4.43 million units from the previous month's 4.71 million. The Investing.com consensus was for 4.38 million. The latest reading represents a 5.9% decrease from the previous month and its ninth decline in a row. October saw a 28.4% decrease year-over-year.
Here is an excerpt from Friday's report from the National Association of Realtors:
"WASHINGTON (November 18, 2022) – Existing-home sales retreated for the ninth straight month in October, according to the National Association of REALTORS®. All four major U.S. regions registered month-over-month and year-over-year declines.
"Total existing-home sales,1 – completed transactions that include single-family homes, townhomes, condominiums and co-ops – decreased 5.9% from September to a seasonally adjusted annual rate of 4.43 million in October. Year-over-year, sales dropped by 28.4% (down from 6.19 million in October 2021).
"More potential homebuyers were squeezed out from qualifying for a mortgage in October as mortgage rates climbed higher," said NAR Chief Economist Lawrence Yun. "The impact is greater in expensive areas of the country and in markets that witnessed significant home price gains in recent years."
In terms of median home sales prices (all), here's the latest:
"The median existing-home price3 for all housing types in October was $379,100, a gain of 6.6% from October 2021 ($355,700), as prices rose in all regions. This marks 128 consecutive months of year-over-year increases, the longest-running streak on record."
For a longer-term perspective, here is a snapshot of the data series, which comes from the National Association of Realtors. The data since January 1999 was previously available in the St. Louis Fed's FRED repository and is now only available for the last twelve months.
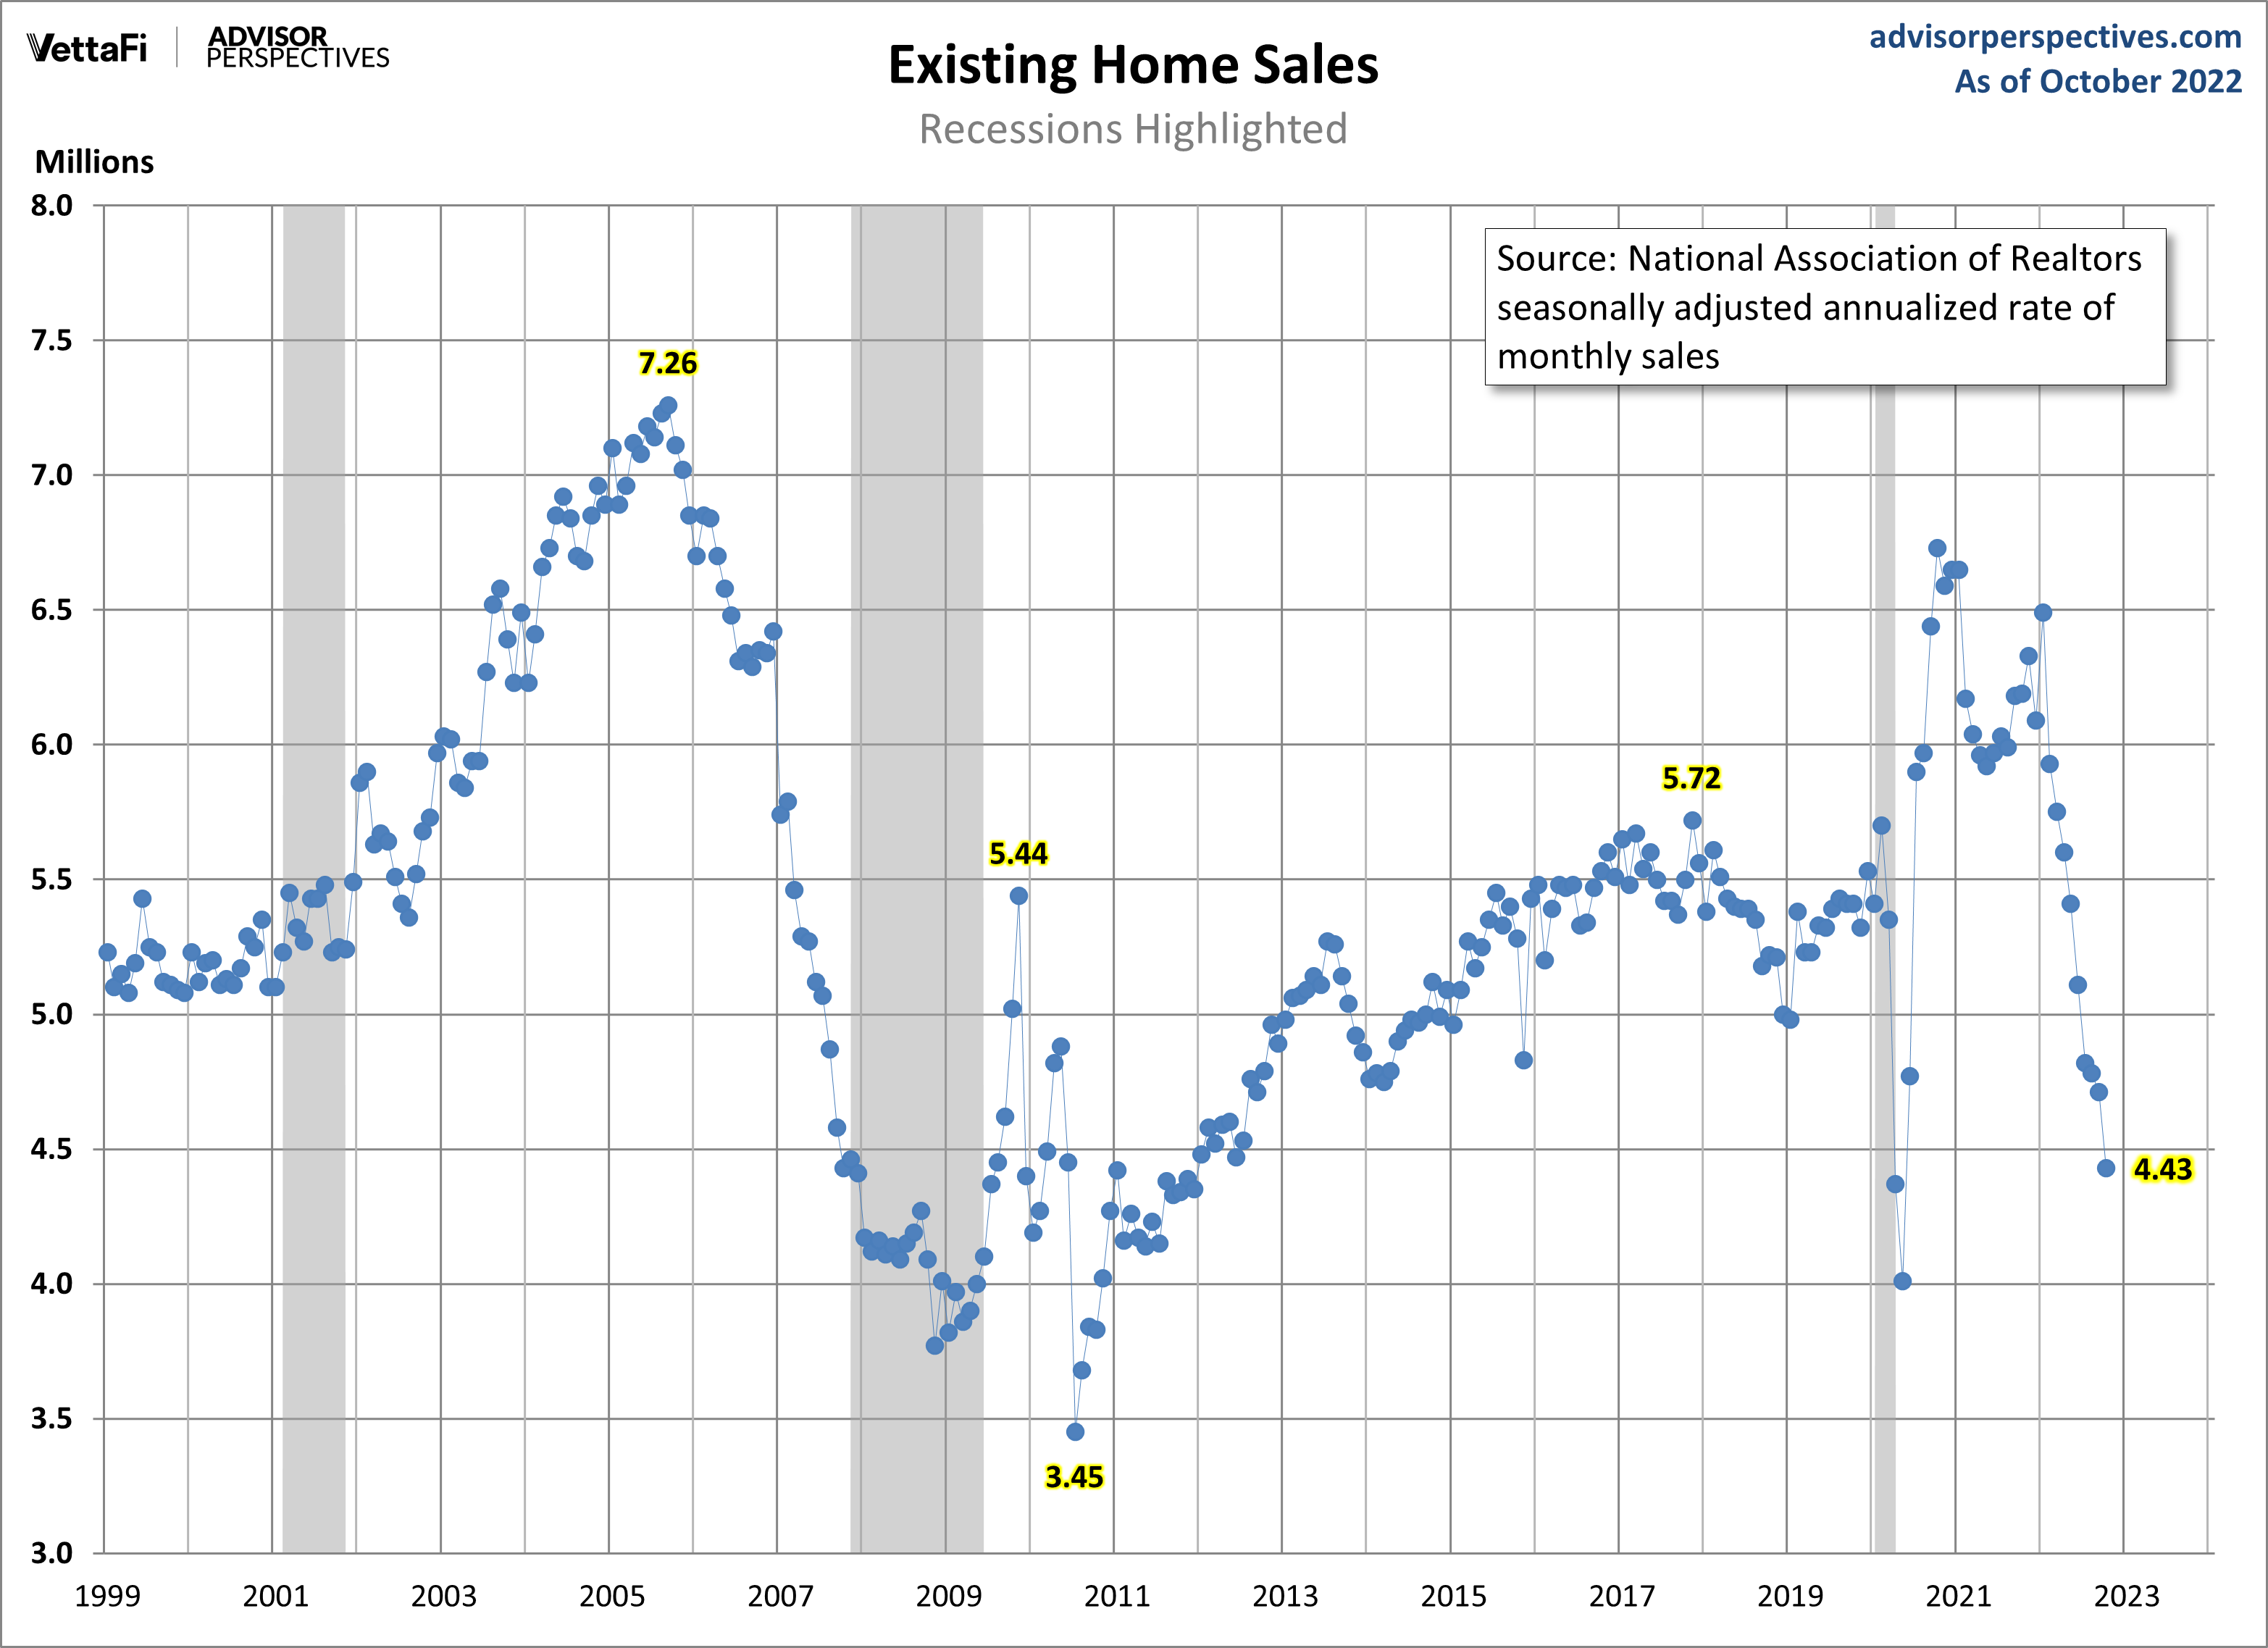
Over this time frame, we clearly see the Real Estate Bubble, which peaked in 2005 and then fell dramatically. Sales were volatile for the first year or so following the Great Recession.
The Population-Adjusted Reality
Now let's examine the data with a simple population adjustment. The Census Bureau's mid-month population estimates show a 20% increase in the US population since the turn of the century. The snapshot below is an overlay of the NAR's annualized estimates with a population-adjusted version.
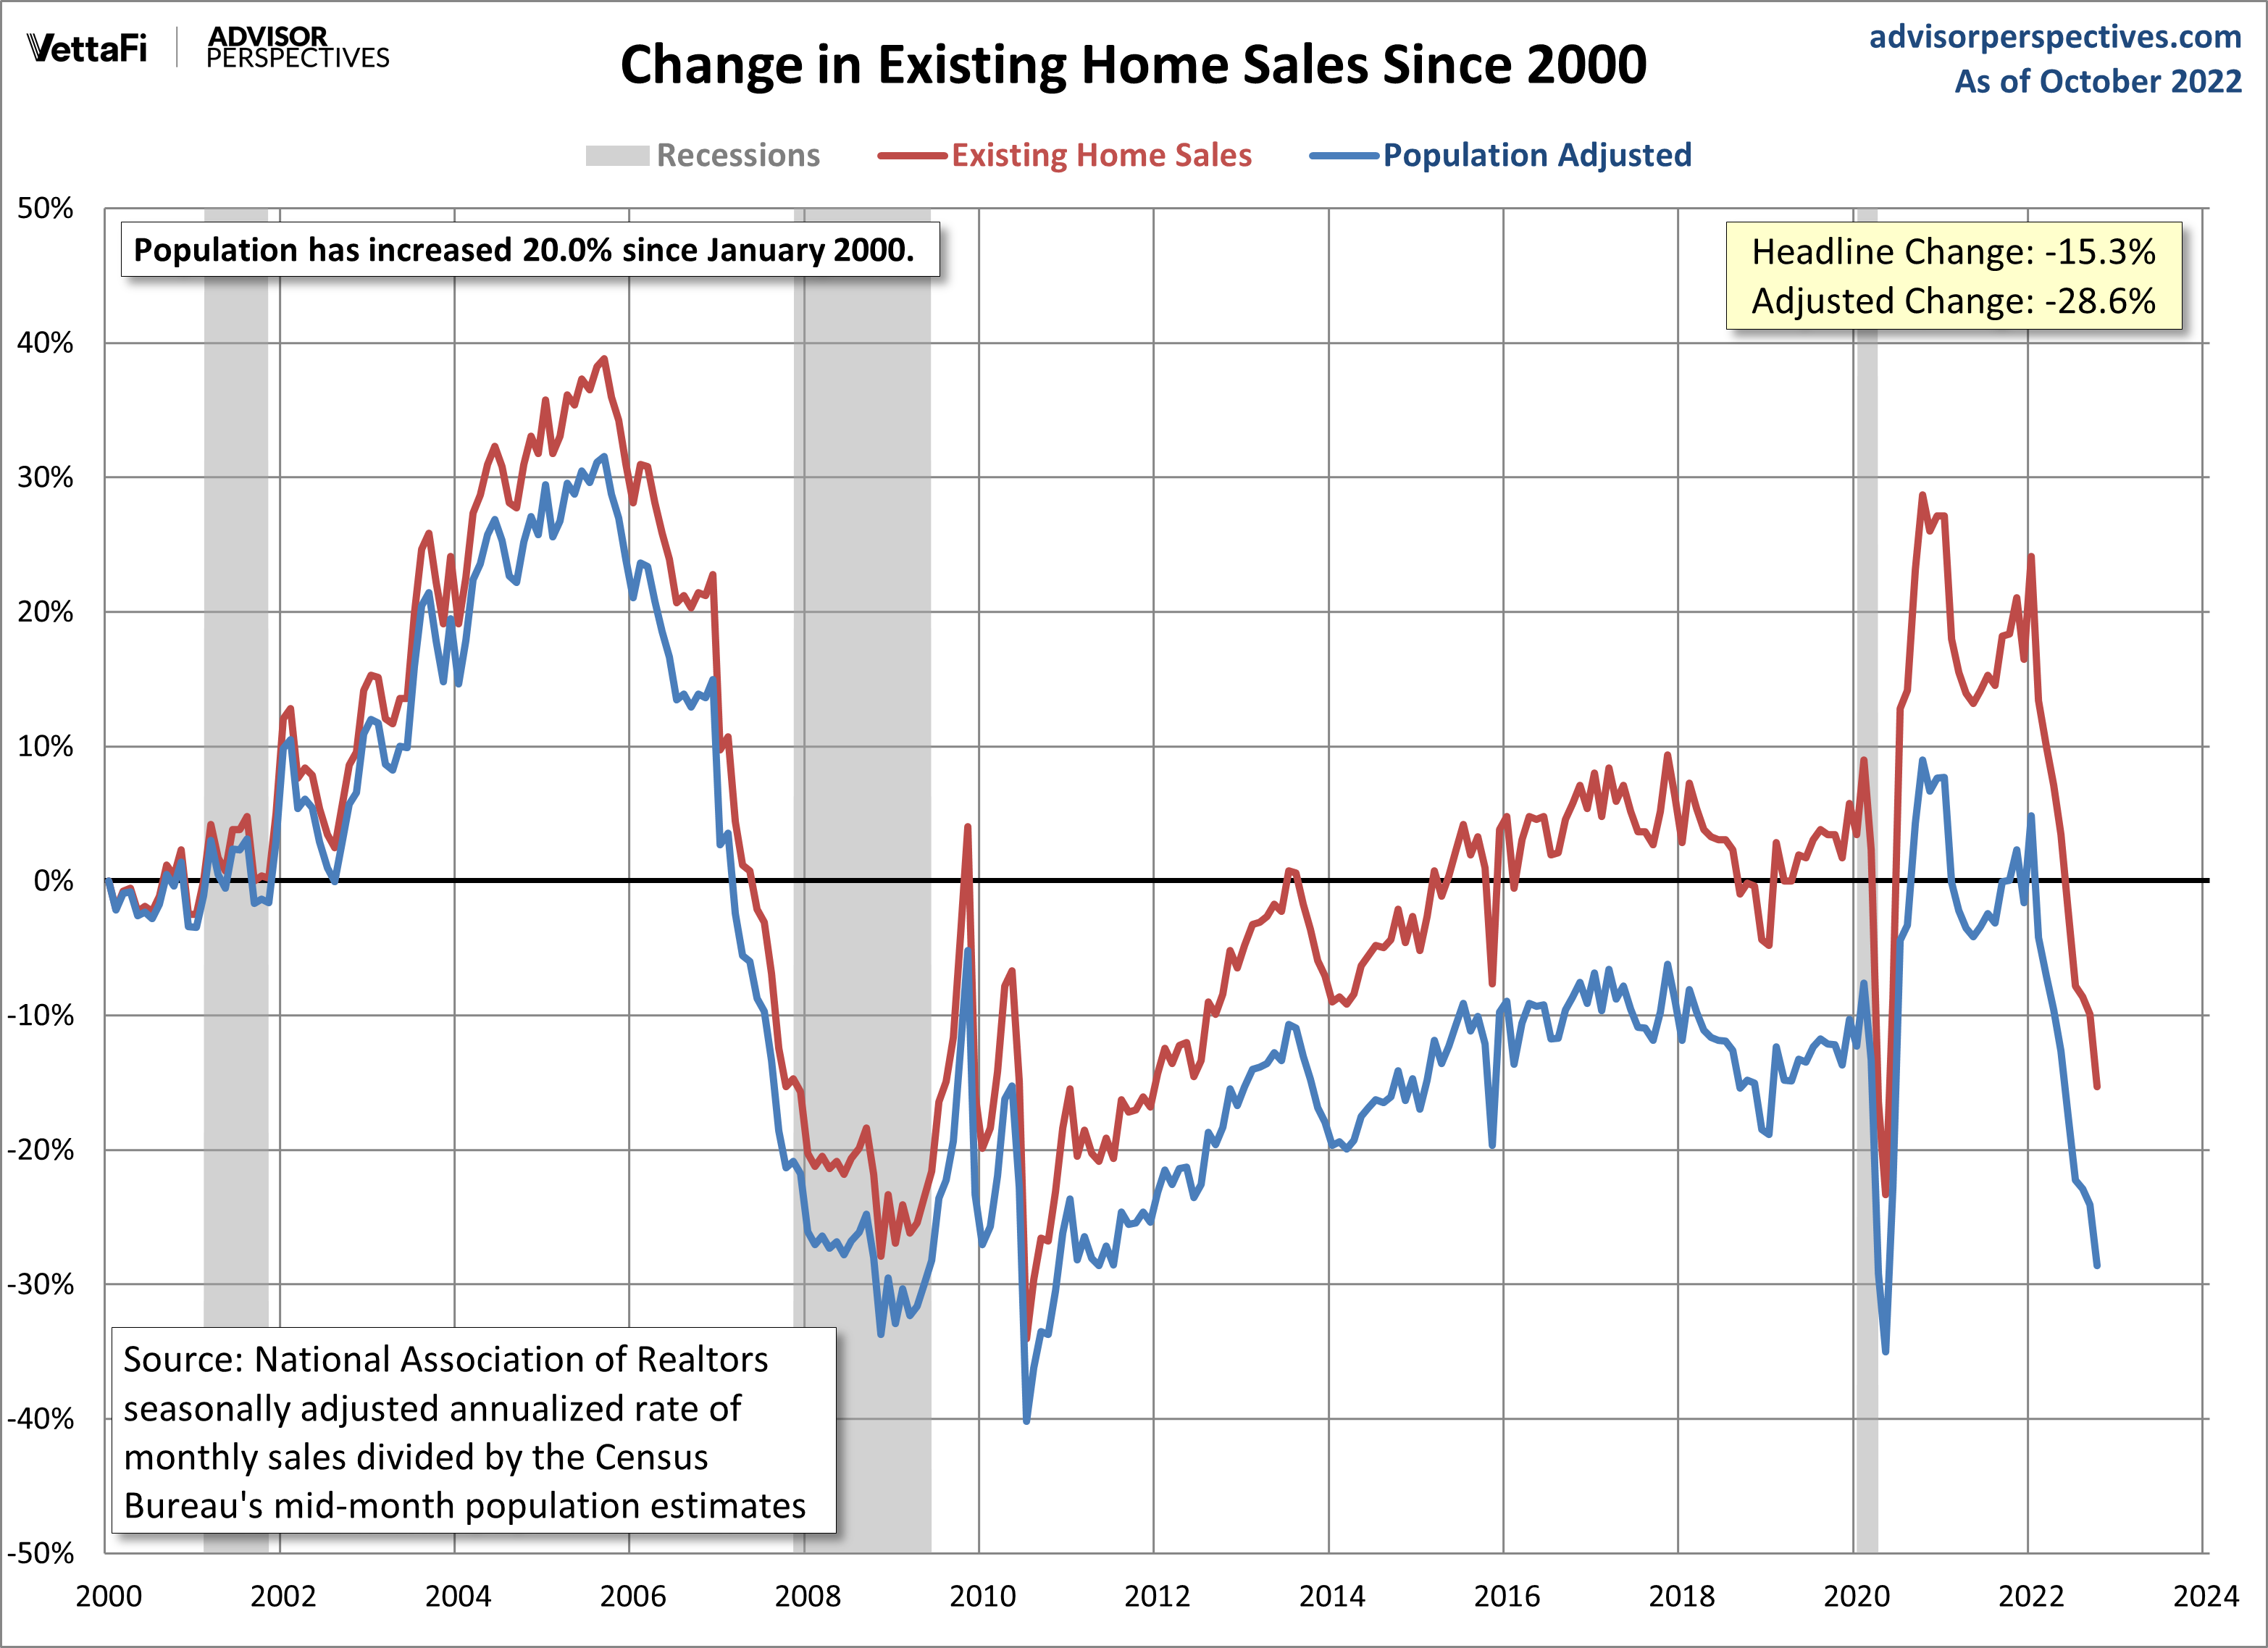
Existing-home sales are 15.3% below the NAR's January 2000 estimate. The population-adjusted version is 28.6% below the turn-of-the-century sales. The next release of existing home sales will be on Dec. 21.
For additional perspectives on residential real estate, here is the complete list of our monthly updates:
- S&P/Case-Shiller Home Price Index
- FHFA House Price Index
- NAHB Housing Market Index
- New Home Sales
- Existing Home Sales
- New Residential Housing Starts
- New Residential Building Permits
- Secular Trends in Permits and Starts
- Pending Home Sales
More By This Author:
Treasury Snapshot - Saturday, Nov. 19S&P 500 Snapshot: Down 16.8% Year-To-Date
Zillow Home Value Index: October Update


Comments
Log in or sign up to join the conversation.