
ETH/USD Bearish Decline Starts ABCDE Triangle Pattern Within Uptrend
Ethereum (ETH/USD) is in a strong uptrend. The bullish momentum is similar or even stronger than Bitcoin’s recent surge above $50k.
But strong bearish candlesticks are now visible on the 4 hour chart… Will this bearish volatility change the outlook? Let’s review the key wave and chart patterns.
Price Charts and Technical Analysis
(Click on image to enlarge)
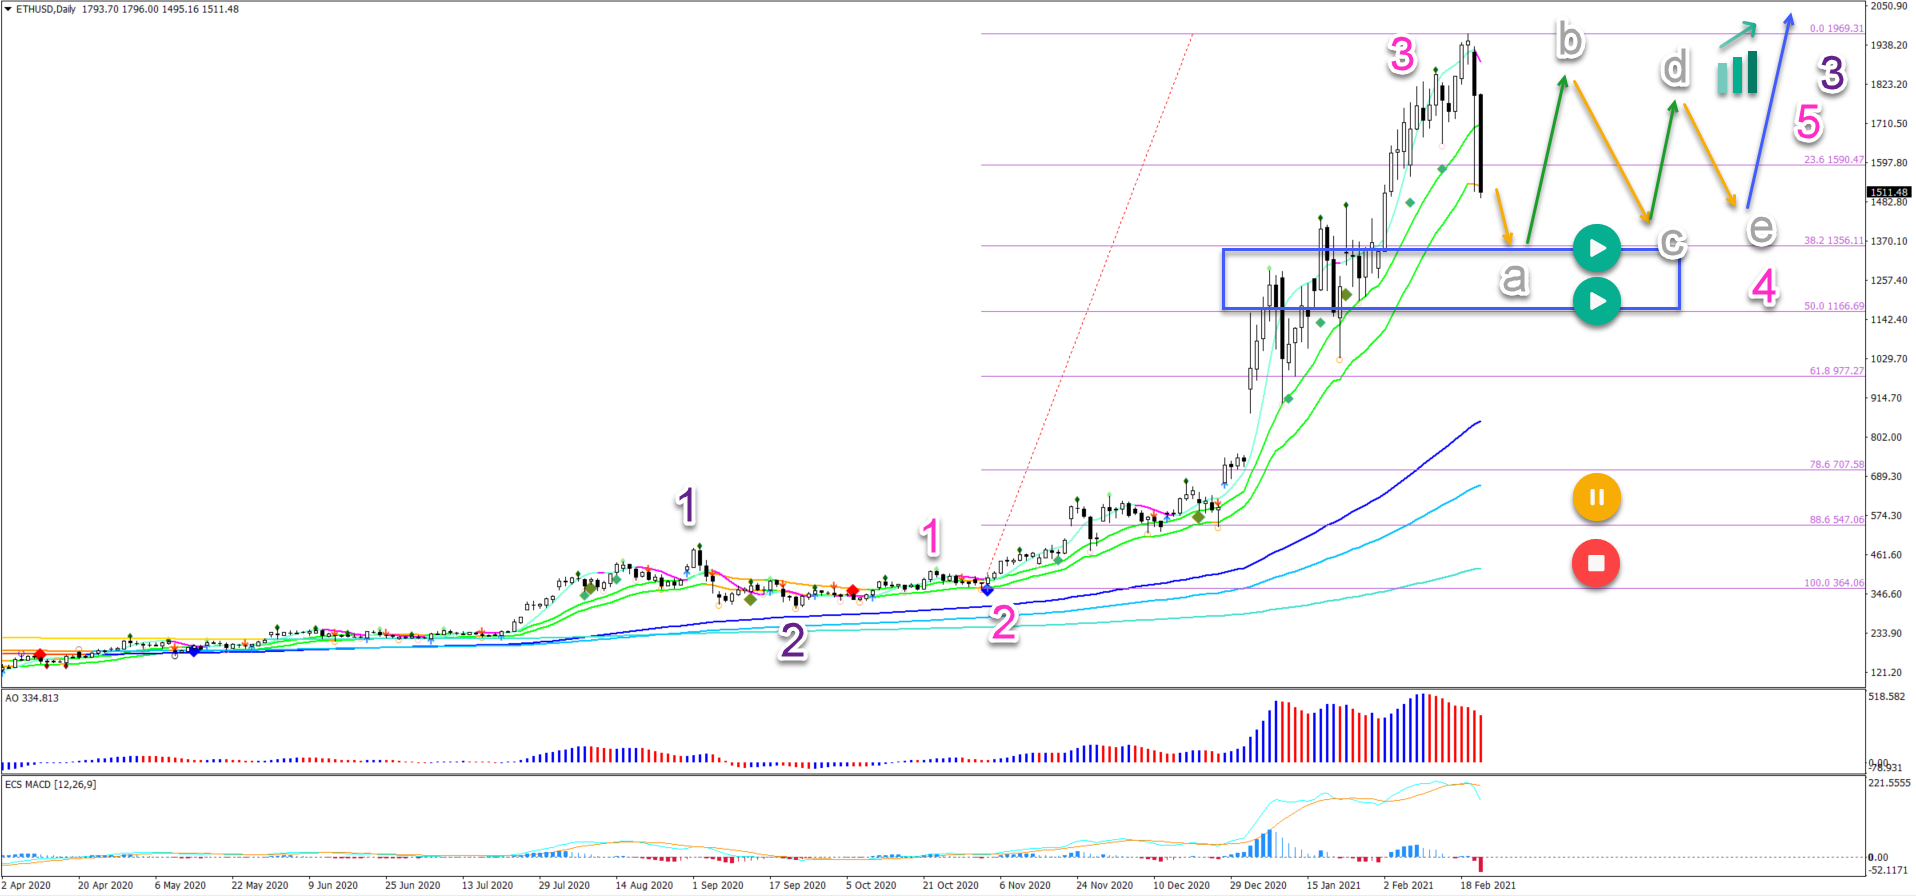
The ETH/USD recent surge up has been strong. Price moved from $400-$500 to the $2,000 resistance level in just 3 months.
Now bearish pressure seems to be actively pushing price action lower again. Is this a reversal or just a retracement?
- In our view, the probability of a retracement is much higher than a reversal. Why? Because the recent push up is a typical wave 3 (pink).
- This means that the current pullback is probably a wave 4 (pink).
- Waves 4 are usually choppy, corrective, and shallow retracements. The 23.6% Fibonacci level already acted as support but price action broke below it.
- The next support zone is the 38.2% Fib or 50% Fibonacci levels. These Fibs are expected to act as support and should create some bounce to the upside.
- The key pattern to look for is an ABCDE triangle pattern. If this chart pattern emerges, then it indicates the end of the retracement. That should give a green light to the uptrend to continue for a new higher high.
After the price action completes 5 waves (grey) in wave 4 (pink), the uptrend should break the pattern and move north (blue arrow). Only a very deep correction puts the uptrend in doubt (orange and red circles).
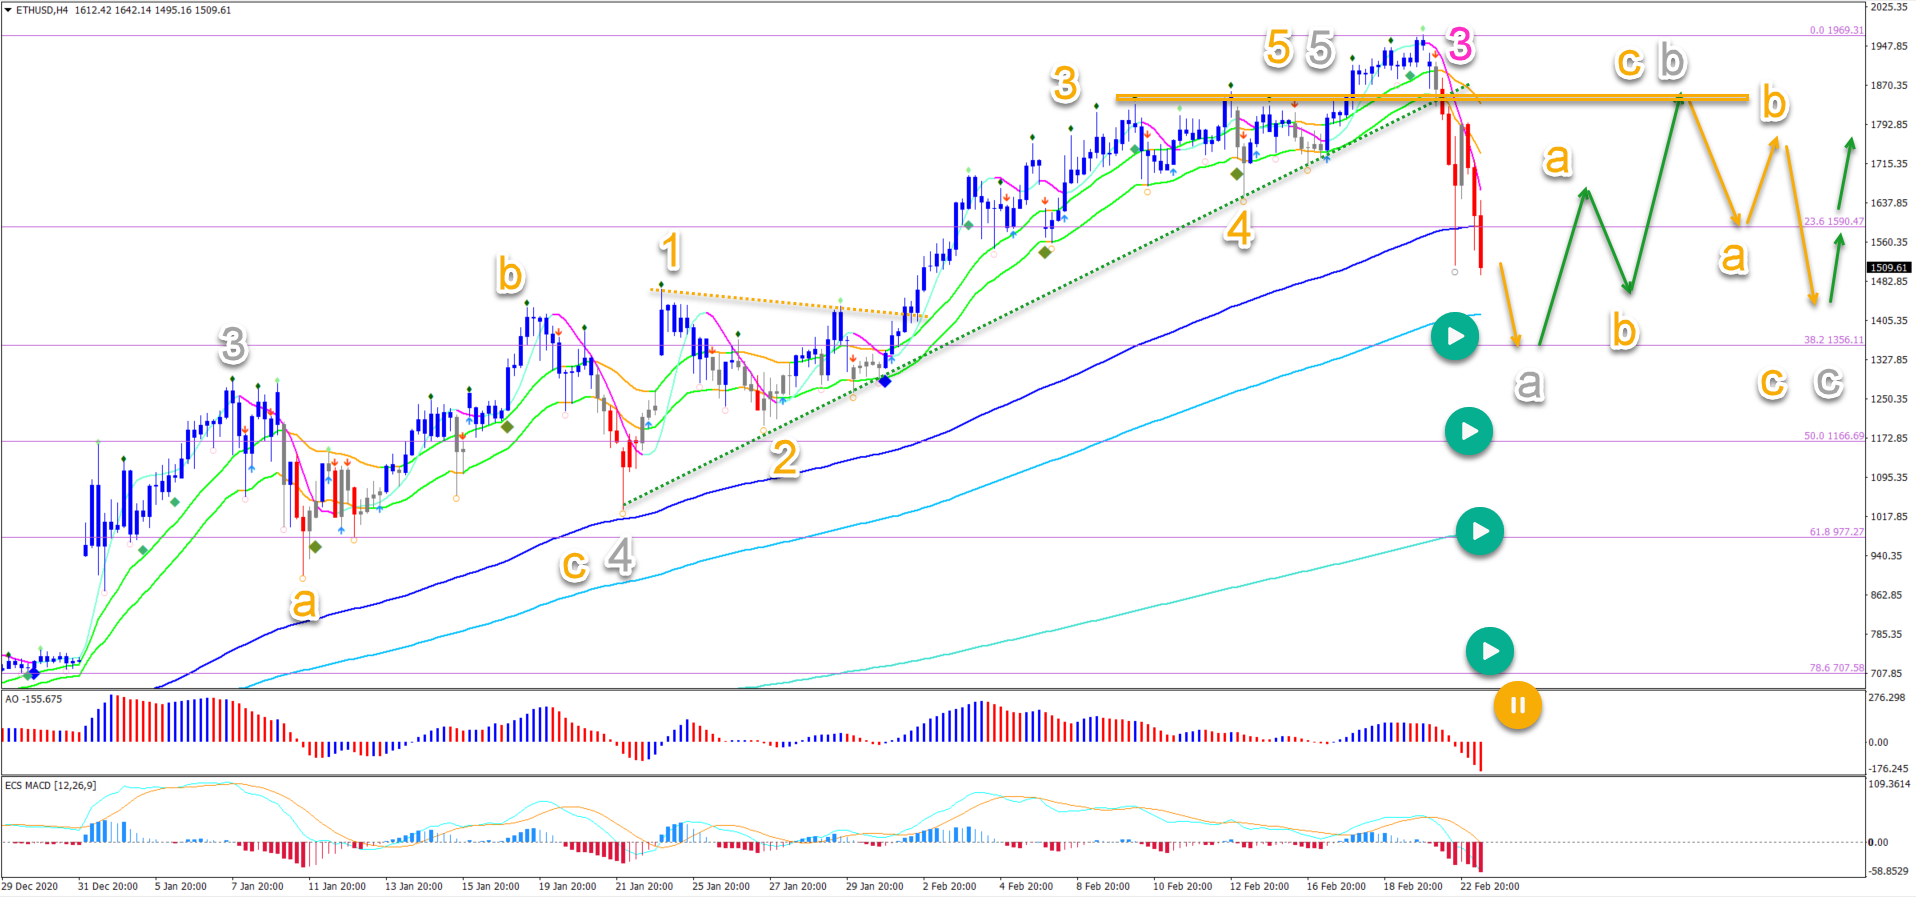
On the 4 hour chart, we can see that the ETH/USD bullish momentum is temporarily over. Price has broken below the support trend line (dotted green) and the 21 ema zone.
Price action should be able to reach the 38.2% Fibonacci level where support support is expected. If a triangle pattern does emerge, then there should be multiple ABC patterns visible in each leg.
(Click on image to enlarge)
Disclaimer: The opinions in this article are for informational and educational purposes only and should not be construed as a recommendation to buy or sell the stocks mentioned or to solicit ...
more

