

Image Source: Unsplash
The current market sentiment often fixates on short-term movements, seemingly ignoring the importance of a broader perspective. For instance, there is an overwhelming amount of opinions circulating under the ETH tag, driven by the desire for instant predictions and social media validation.
Truth be told, the addition of an “Ethereum prediction for tomorrow” is a real problem.
However, this short-term focus is rarely profitable in the volatile world of cryptocurrency. Long-term analysis is crucial for success, given the inherently erratic nature of digital assets.
We are much more interested in the big picture. What about analyzing the question of whether and when ETH may go to $100,000? It’s certainly an intellectual challenge; it helps focus on the big picture as long as the analysis and underlying methodology is unbiased.
Ethereum's Broad Market Chart Insights
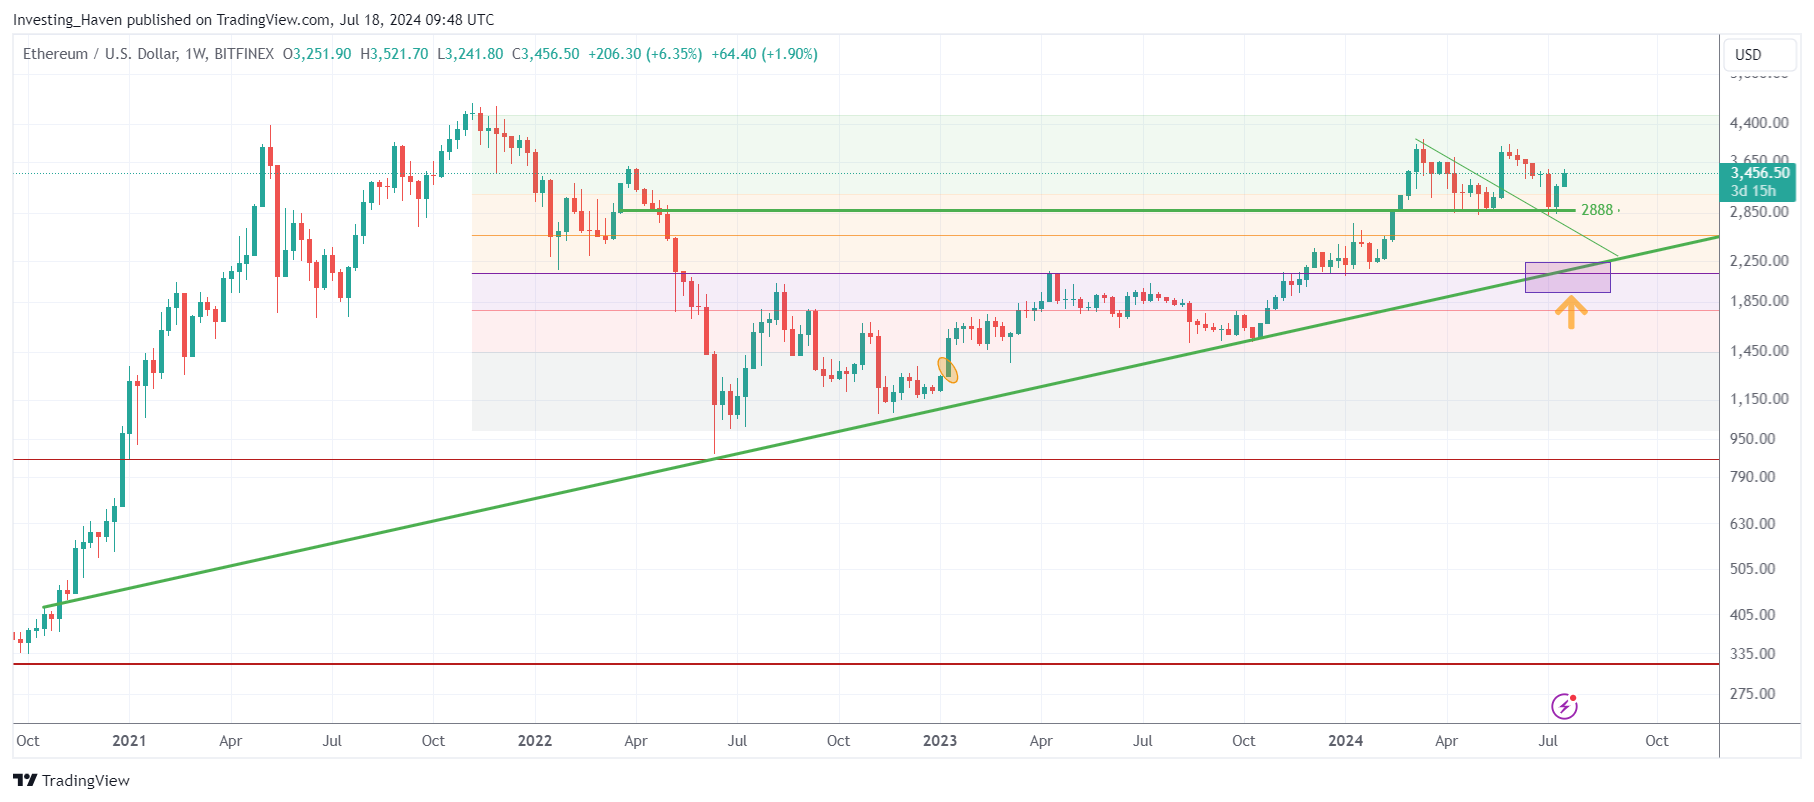
Ethereum’s long-term chart is a valuable tool, offering insights that are often overlooked by short-term traders. Here are the key takeaways from Ethereum's macro chart:
- The long-term rising trendline is crucial and should not be breached.
- The short-term falling trendline intersects with the long-term rising trendline in late summer 2024.
- Critical horizontal levels include the reversal level at $2,888 and two important Fibonacci levels.
These highlights provide straightforward answers amid the market noise.
(Click on image to enlarge)
Short-Term Outlook for Ethereum in August 2024
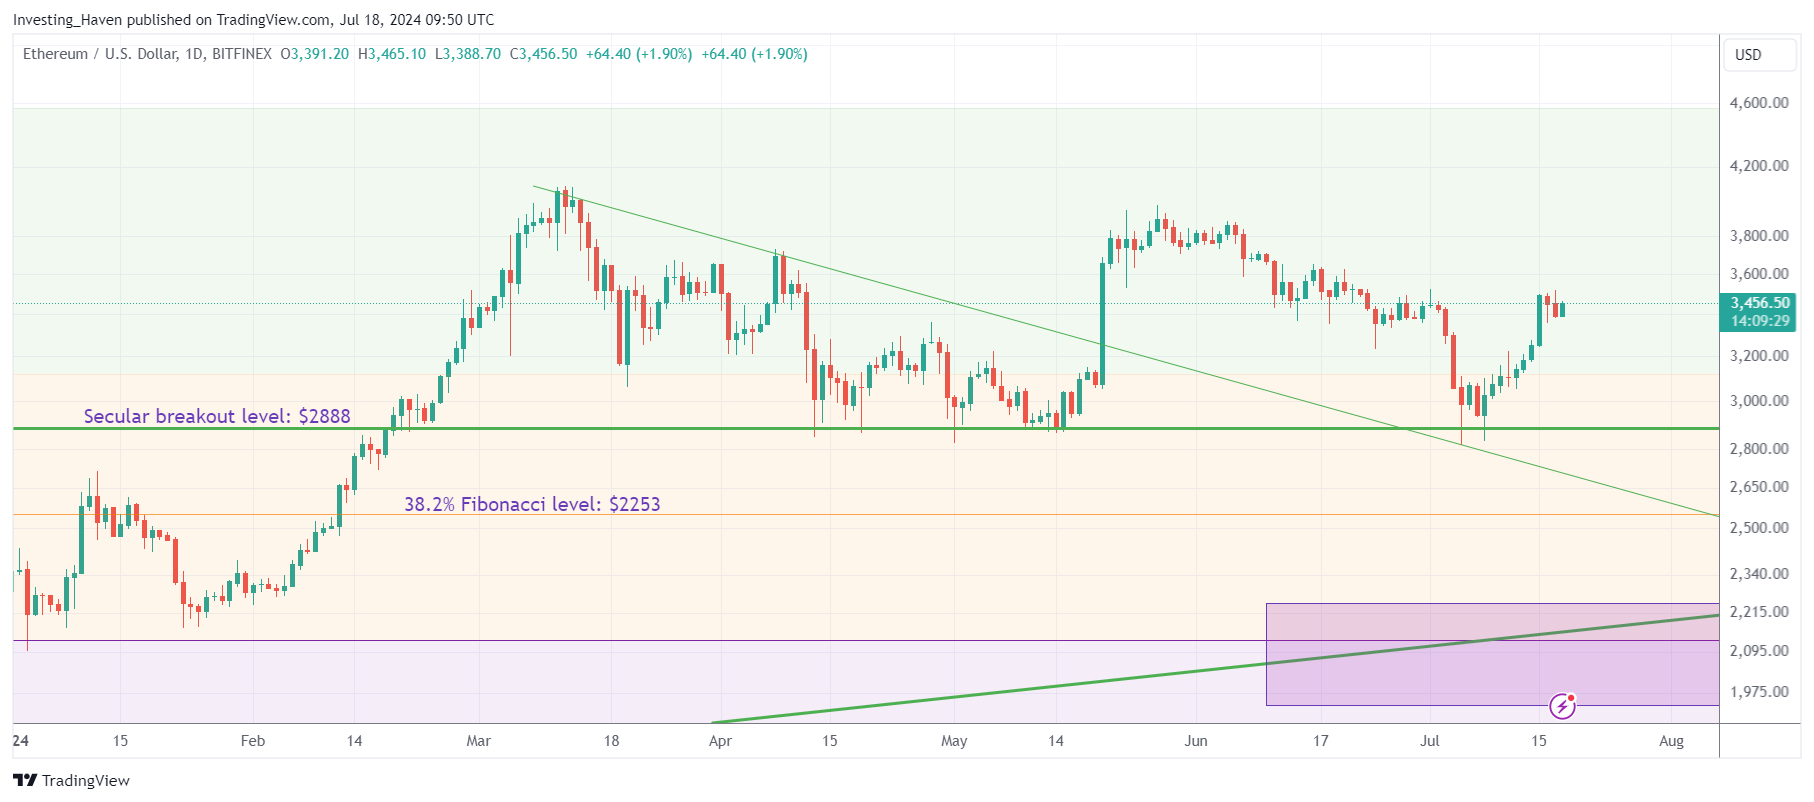
While long-term trends offer stability, understanding short-term movements is equally important. For August 2024, several price points warrant attention. Specifically, there’s a potentially interesting time/price alignment: $2,888 on August 28th.
The most bullish scenario would see ETH maintaining the $2,888 level throughout August, and ideally into September and October. Should ETH dip below this point, the 38.2% Fibonacci level at $2,253 could still support a bullish outcome (less bullish compared to $2,888 being respected as long term support).
If the $2,888 level is tested on August 28th and holds in the subsequent weeks, it could be a prime buying opportunity. However, all conditions must align for this scenario to materialize.
(Click on image to enlarge)
Volatility in August 2024
We do anticipate increased volatility in August, according to our timeline analysis. That’s not just in crypto but across broader markets as well.
Recent market movements, such as Nvidia's sudden drop followed by subsequent tech sell-offs, illustrate that this trend may be underway.
Crypto markets often lead tech trends, as seen in October 2020, September 2021, January 2023, and October 2023. Given this pattern, maintaining a defensive stance until broader markets stabilize and Bitcoin shows signs of exhaustion and recovery is prudent.
More By This Author:
Silver Investors: Mark These Two Dates In Your CalendarsJune 13, 2024 – A Decision Point For Crypto Markets This Summer
October Of 2024 Will Be Crucial Month For Cryptocurrency Investors


Comments
Log in or sign up to join the conversation.