

Image Source: Pixabay
Ethereum with ticker ETHUSD is sharply bouncing on a daily chart, so looks like a three-wave ABC decline in wave C is finished and we are now tracking a new three-wave ABC rally within wave D back to the upper triangle.
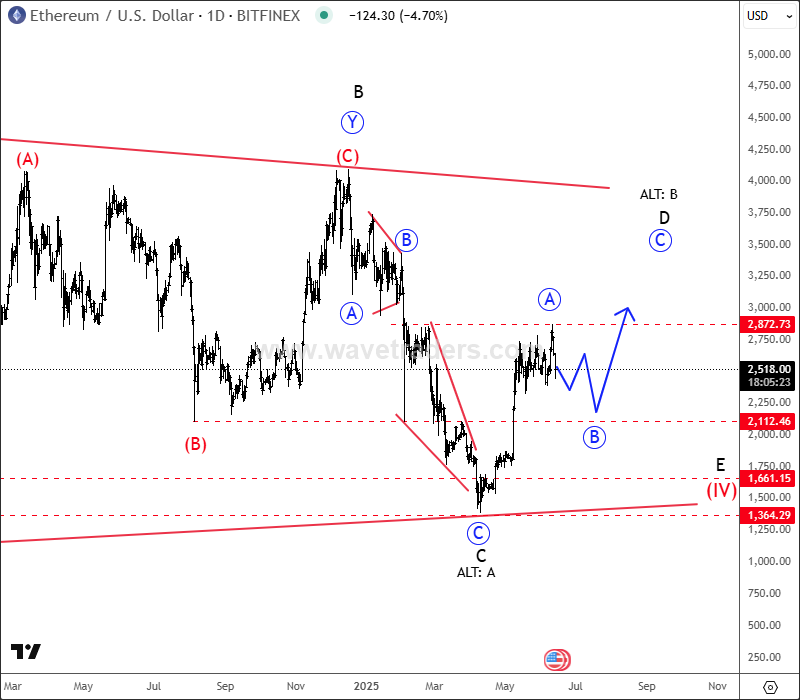
ETHUSD Daily Chart
In the 4-hour chart, it made a nice and clean five-wave impulse into wave A, but with the current sharp decline, seems like it’s now trading in a higher degree ABC correction within wave B that can retest 2100 – 2000 support area before a continuation higher within wave C of D.
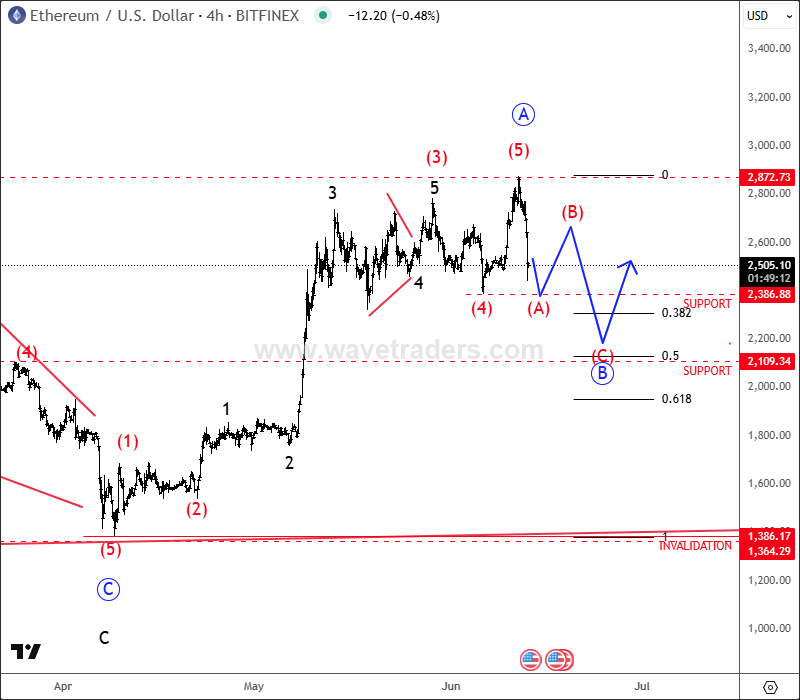
ETHUSD 4h Chart
For a detailed view and more analysis like this you may want to watch below our latest recording of a live webinar streamed on June 09 2025: Direct Link.
More By This Author:
AI Cryptocurrencies Are About To Fly; Summer Rally Incoming?
USDMXN Keeps Falling Within An Impulse; Elliott Wave Intraday Analysis
MARA Is Waking Up And Looks Promising For The Crypto Market


Comments
Log in or sign up to join the conversation.