Ethereum Price Prediction: Risky Pattern Points To A Breakdown

Image Source: Pixabay
- Ethereum has underperformed key markets like Bitcoin and Tron recently.
- It has lost its sizable market share in industries like DeFi and stablecoins.
- Ethereum ETF inflows have underperformed those of Bitcoin.
Ethereum price remains in a deep bear market, continuing to underperform other top cryptocurrencies like Tron, Bitcoin, and Solana. The ETH token was trading at $2,500 on Monday, a few points above last week’s low of $2,385. It has dropped by almost 40% from its highest level this year, giving it a market cap of $300 billion.
Ethereum sluggish ETF inflows
The first reason why Ethereum price has remained in a bear market is because of the ongoing sluggish demand of ETFs from institutional investors.
Ethereum ETFs have had cumulative outflows of $504 million, bringing the total assets to $6.8 billion. Before the ETF approvals, the Grayscale Ethereum Trust (ETHE) had over $10 billion in assets.
Blackrock’s ETHA has $1.09 billion in assets, while Grayscale’s ETHE now has $3.95 billion. Fidelity’s FETH has $423 million, while Bitwise’s ETHW has $241 million.
In contrast, Bitcoin ETFs are firing on all cylinders, with cumulative inflows of almost $22 billion. They all now hold over $65 billion in assets, a sign that investors are more comfortable holding them.
ETH exchange reserves have risen
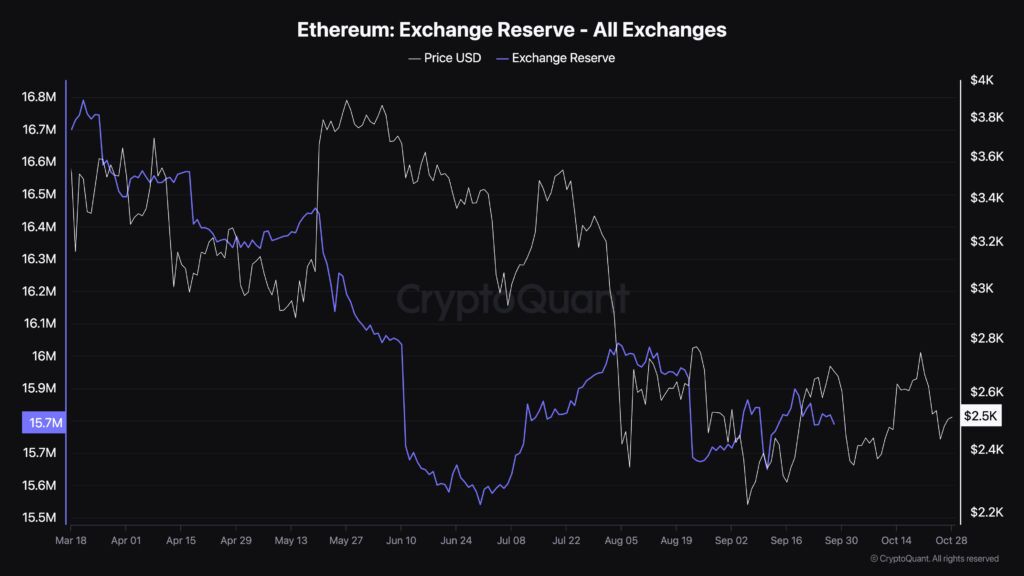
The other important reason why Ethereum price has struggled is that the amount of coins in exchanges has risen in the past few months. Data by CryptoQuant shows that the amount has risen from 15.4 million in July to over 15.8 million.
A big increase in the amount of Ethereum in exchanges is a sign that many holders are starting to sell their coins. Some of the most prominent sellers were the likes of Vitalik Buterin and the Ethereum Foundation, who have deposited thousands of coins to exchanges in the past few months.
There are signs that many investors have started to sell their coins. For example, data by Bybit shows that a user deposited Ethereum worth $44.8 million coins to Coinbase on Monday morning. Another user deposited coins worth $750k, while another one moved coins worth $33 million on Saturday.
(Click on image to enlarge)

Ethereum is losing market share
The other important reason why Ethereum price has underperformed the market is that it has continued to lose market share across all sectors.
First, on stablecoins, it has lost its share to Justin Sun’s Tron, which has now become the biggest mover of Tether, the biggest stablecoin in the industry. Data by TronScan shows that the network had a Tether trading volume of $34 billion on Sunday. In most cases, the figure is usually much higher than that.
Second, Ethereum is no longer the favorite platform among developers because of its slow speeds and high transaction costs. A good example of this is in the meme coin industry, where Solana has become the best chain for that.
As a result, meme coins like Bonk, Popcat, and Cat in a Dog World have attained a $1 billion+ market cap. All Solana meme coins have a market cap of over $11.2 billion, a figure that may continue growing.
Third, data shows that Ethereum is not the favorite chain for DEX traders. According to DeFi Llama, Solana’s DEX transactions jumped by 20% in the last seven days to $15.7 billion, while Ethereum’s dropped by 0.20% to $8.8 billion.
Ethereum could lose more share when Uniswap, the biggest DEX in its ecosystem launches Unichain, its layer 2 network.
Additionally, Ethereum has lost market share in industries like Decentralized Public Infrastructure (DePIN) and Non-Fungible Tokens (NFT).
Ethereum price forecast
(Click on image to enlarge)

Ethereum price chart by TradingView
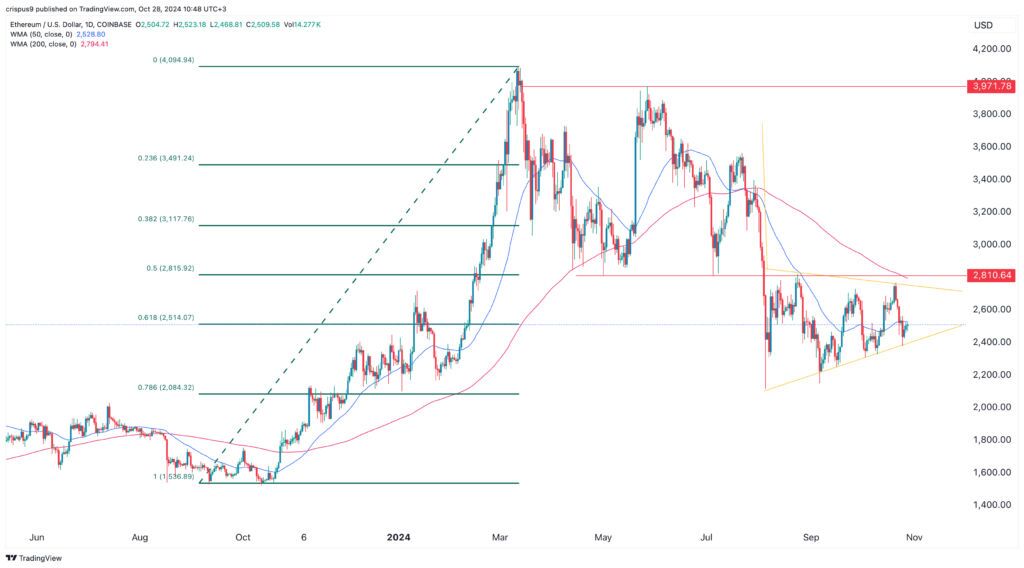
The daily chart shows that the ETH price formed a double-top pattern around the $4,000 level. It then moved below the neckline at $2,810, its lowest point on May 1, and the 50% Fibonacci Retracement point.
Ethereum also formed a death cross pattern as the 50-day and 200-day Weighted Moving Averages (WMA) crossed each other.
Worse, the token has formed a bearish pennant pattern, a popular bearish sign. In most periods, this is one of the most bearish signs in the market.
With the triangle part of the pennant nearing its confluence, there is a likelihood that it will have a bearish breakout soon. If this happens, Ethereum could drop to the next key support at $2,000, its lowest point in August.
More By This Author:
Is The Coinbase Stock A Buy Or A Sell Ahead Of Its Q3 Earnings?Can T-Mobile Shares Keep Heading Higher?
Gold And Copper Slip As Dollar Firms; Palladium Extends Gains
Disclosure: Invezz is a place where people can find reliable, unbiased information about finance, trading, and investing – but we do not offer financial advice and users should always ...
more


