

Image Source: Pexels
Ethereum (ETHUSD) Elliott Wave Technical Analysis
Ethereum (ETHUSD)
Elliott Wave Analysis TradingLounge 3-Daily Chart, 3 August 2022,
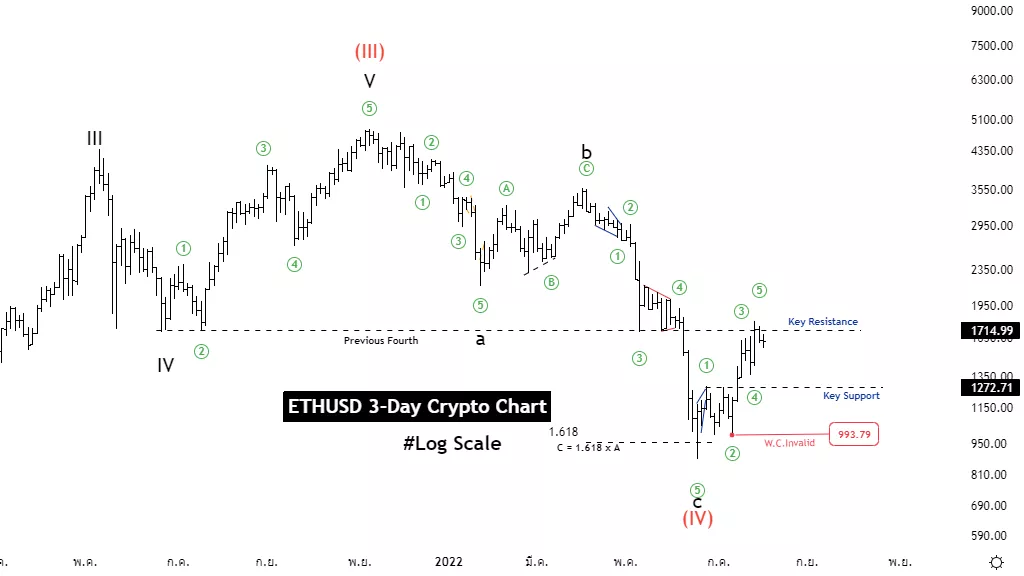
Structure: Zigzag
Position: Wave C
Direction Next higher Degrees: Impulse wave (IV)
Details: Wave C may be over and from this point, it may be until the start of a new uptrend.
Wave Cancel invalid Level: 993.79
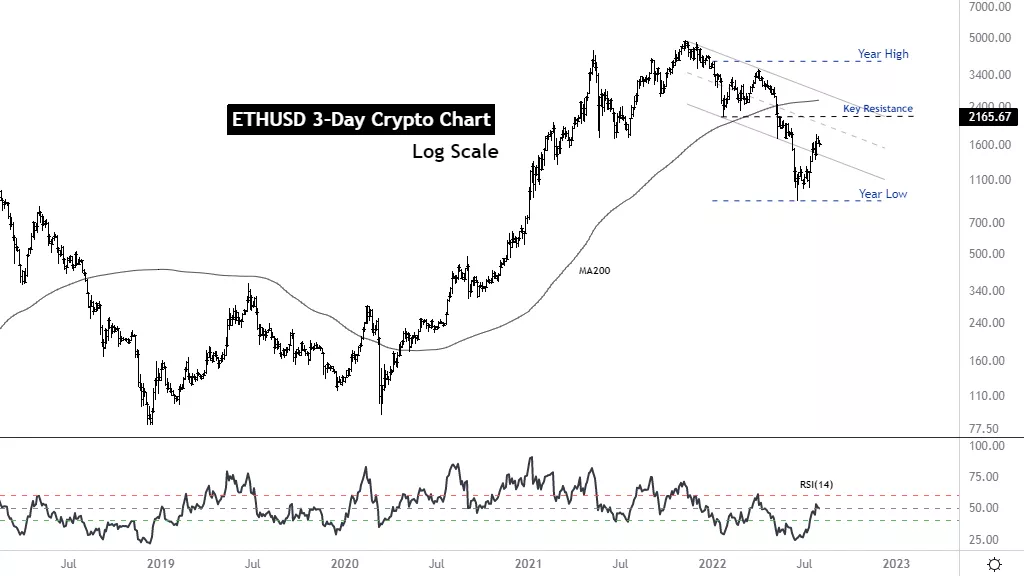
Ethereum Trading Strategy: Since the price has already moved very high from the low of the year, entering a long position might not be a good idea now, wait for the throwback to reconsider.
Ethereum Indicators: The price approaches the key resistance level and the 200-period moving average may be a short-term reversal.
Source: tradinglounge com Elliott Wave Analyst: Kittiampon Somboonsod
(Click on image to enlarge)
Ethereum (ETHUSD)
Elliott Wave Analysis TradingLounge 4H Chart, 3 August 2022,
ETHUSD Elliott Wave Technical Analysis
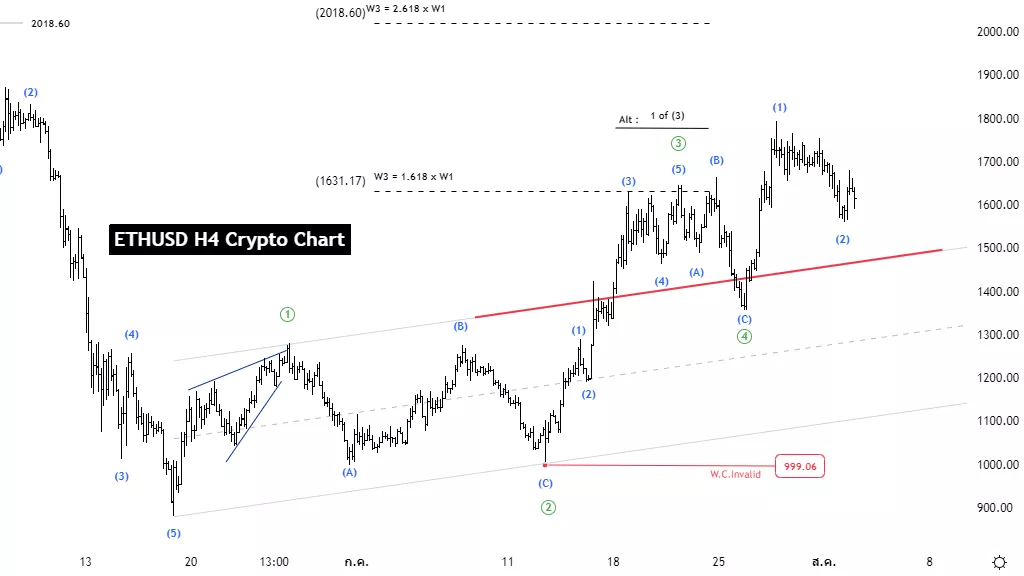
Mode: Motive
Structure: Impulse
Position: Wave 2
Direction Next higher Degrees:
Details: rising in wave 3 or 5
Wave Cancel invalid Level: 993.79
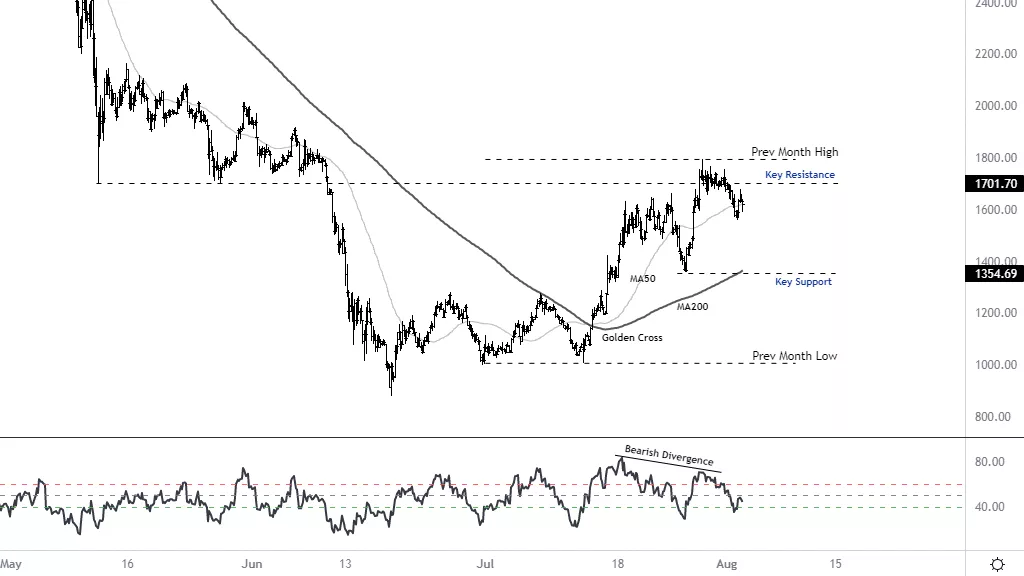
Ethereum Trading Strategy: The price has bounced back from the key resistance and has moved up quite a lot from the previous month's low. So, in the short term, there is an opportunity to test the support at the 1354.69 level. This could be an opportunity to join the trend again.
Ethereum Technical Indicators: A golden cross has occurred. The trend may turn bullish, but as RSI (14) has a short-term divergence signal, there may be a throwback
(Click on image to enlarge)
More By This Author:
Big Tech and Big Finance Elliott Wave Readings
DAX 40, FTSE 100, STOXX 50, Dollar Index DXY, EURUSD - Elliott Wave
Dogecoin Elliott Wave Technical Analysis


Comments
Log in or sign up to join the conversation.