Ethereum Elliott Wave: Forecasting The Path
Hello traders. In this technical article we’re going to take a look at the Elliott Wave charts charts of Ethereum published in members area of the website. As our members know ETHUSD reached extreme zone (buying zone) in the cycle from the April 16th peak. In further text we’re going to explain the Elliott Wave structure and the forecast.
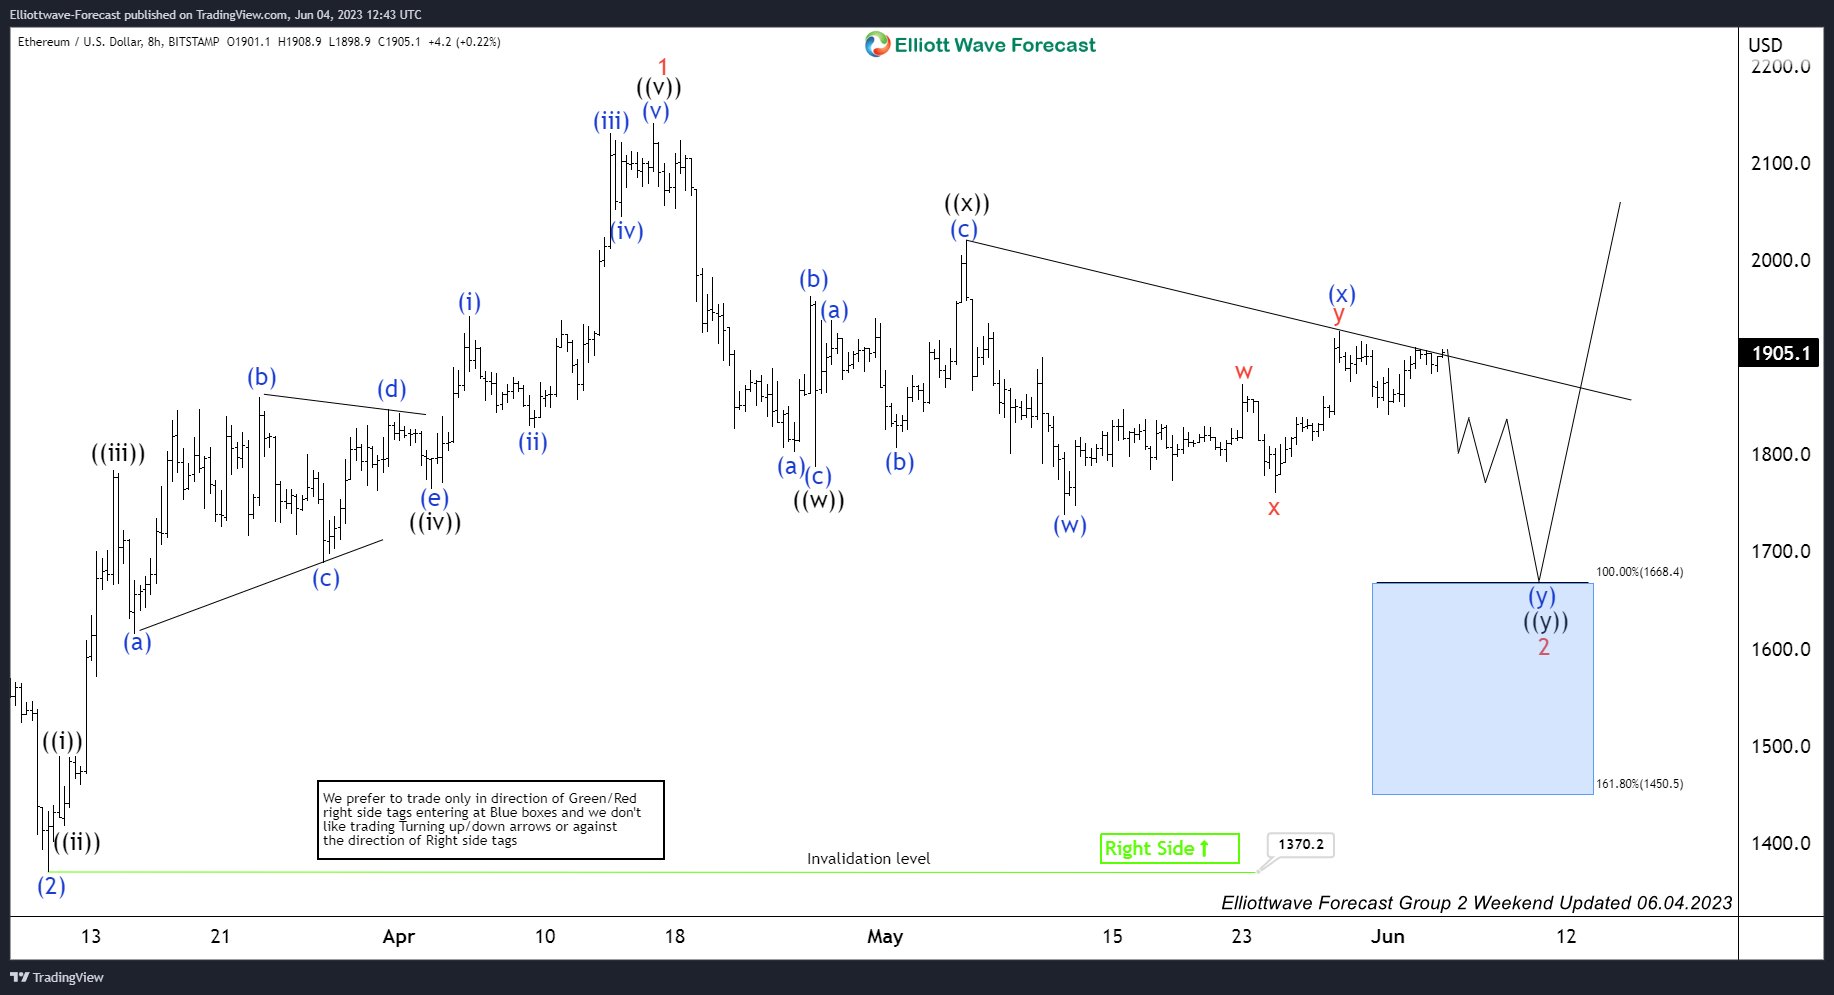
ETHUSD 4h Hour Asia Elliott Wave Analysis 06.04.2023
ETHUSD is showing incomplete bearish sequences in the cycle from the April 16th peak. At this stage we believe correction is unfolding as Elliott Wave Double Three Pattern. We call (x) blue connector completed at the 1927 high. As far as the price stays below that high, Ethereum should ideally make another leg down toward 1668.4-1450.5 area. At the marked blue box zone buyers should ideally appear again.
(Click on image to enlarge)
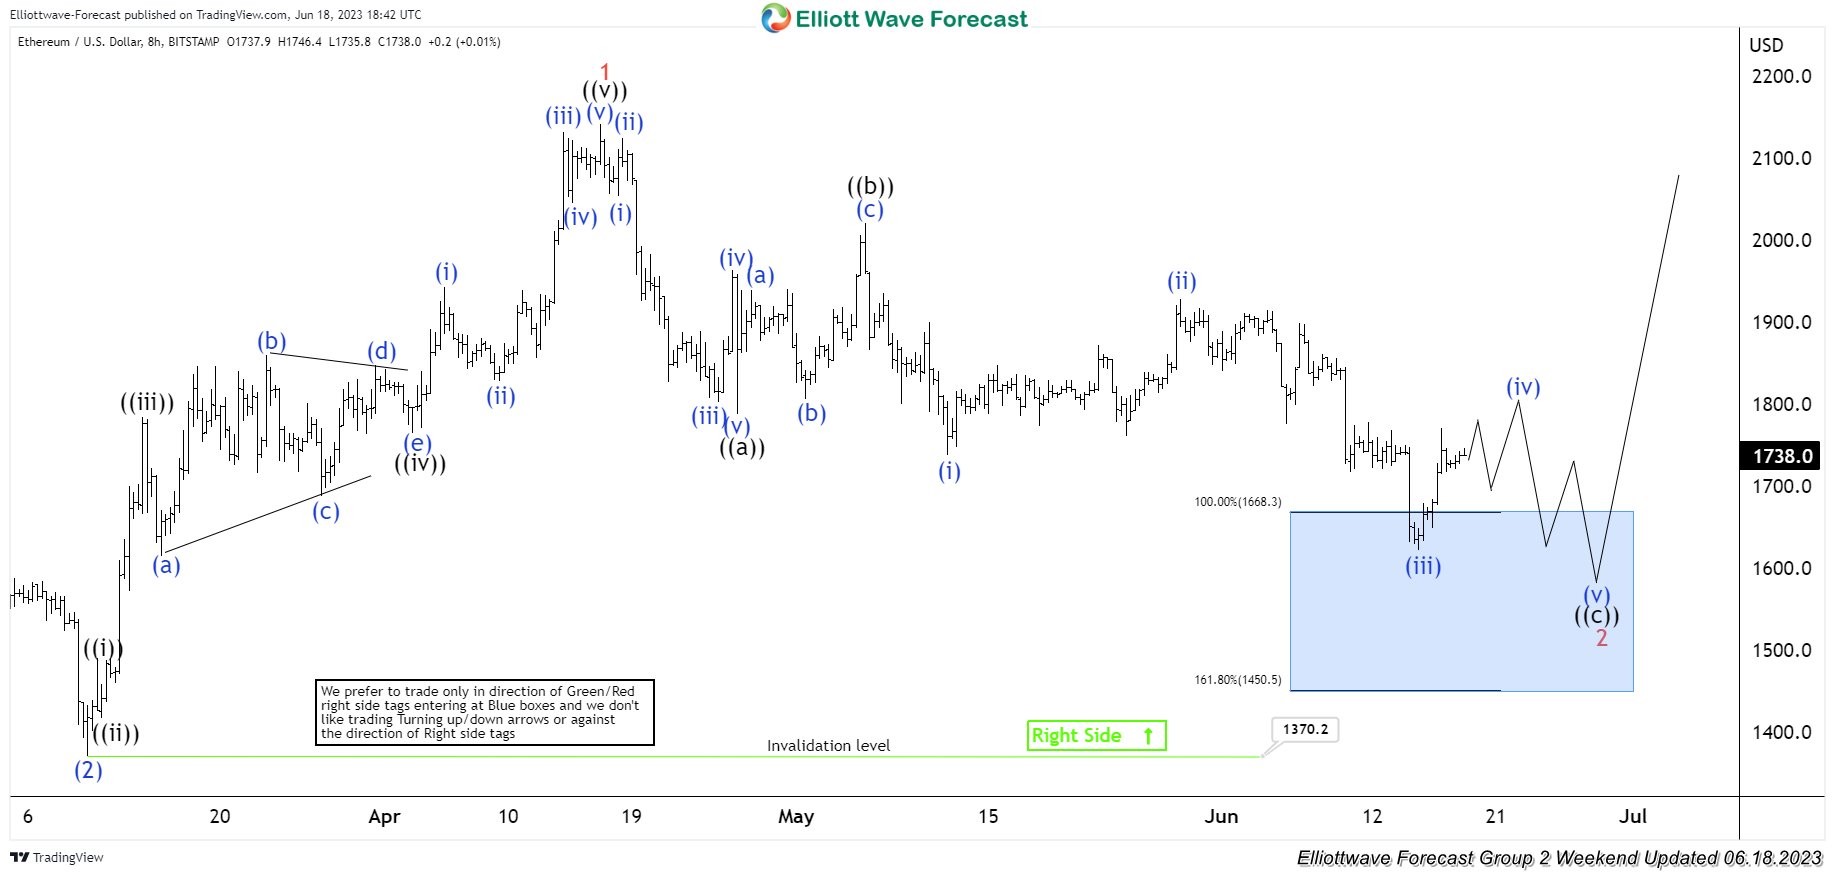
ETHUSD 4h Hour Asia Elliott Wave Analysis 06.18.2023
We got the decline as expected. Eventually ETHUSD reached extreme zone, blue box (buying zone). So far reaction from the blue box is still shallow. Ethereum still can see another leg down within extreme zone to complete the cycle.
Keep in mind that market is dynamic and presented view could have changed in the mean time. You can check most recent charts in the membership area of the site. Best instruments to trade are those having incomplete bullish or bearish swings sequences.
(Click on image to enlarge)
More By This Author:
Is Costco Wholesale Ready For The Next Rally?JPMorgan (JPM) Shares Are Not Ready For A Pullback
Bullish Sequence Will Fuel Novo Nordisk To More Upside
Disclaimer: Futures, options, and over the counter foreign exchange products may involve substantial risk and may not be suitable for all investors. Leverage can work against you as well as for ...
more


