Ethereum Drops Below A Key Level: What You Need To Know

Photo by Executium on Unsplash
Ethereum ETH shares are trading significantly lower Monday as the crypto market is seeing a big dip.
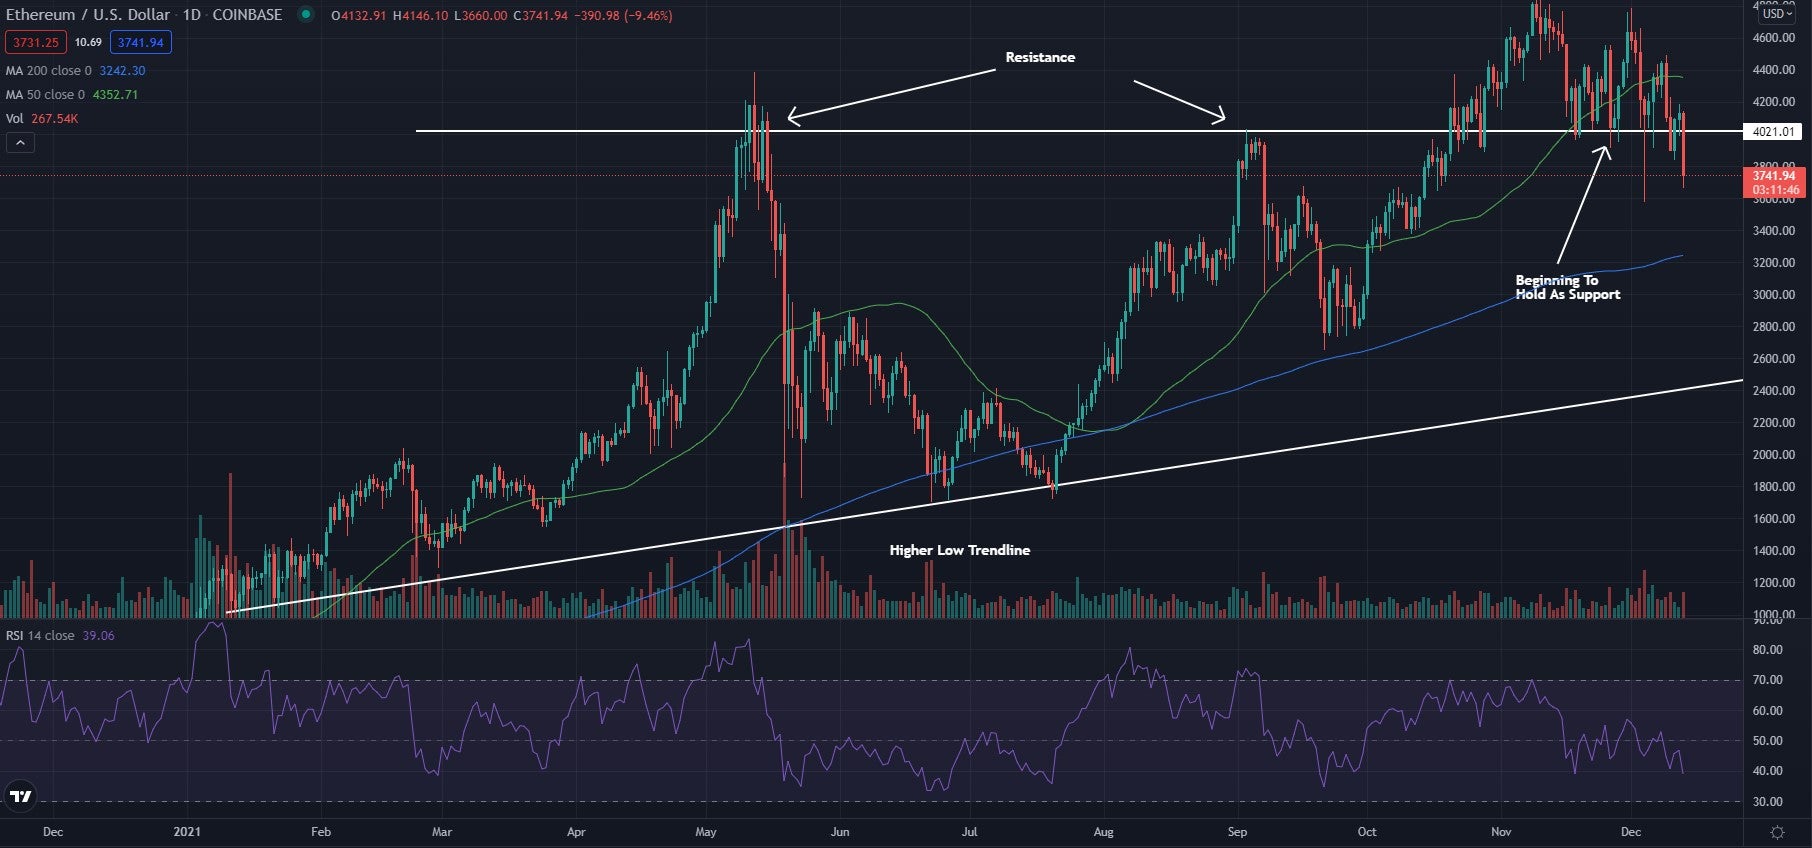
Ethereum looks to have broken back below the $4,000 level where it has found resistance in the past. This is a sign for traders to be wary in the future as the price could make a large movement downward if unable to hold above this trendline.
Ethereum was down 10.16% at $3,739.15 at publication Monday afternoon.
Ethereum Daily Chart Analysis
- Ethereum looked to have broken out of the ascending triangle pattern it was in and was consolidating before the break back below the $4,000 level. This hints the crypto could see a breakdown in the future if unable to recover.
- The crypto trades below the 50-day moving average (green) but above the 200-day moving average (blue). This shows the crypto looks to be in a period of consolidation and the 50-day moving average may act as resistance, while the 200-day moving average may hold as support.
- The Relative Strength Index (RSI) has been slowly pushing lower throughout the past couple of weeks and sits at 38. This shows that there are slightly more sellers in the market than there are buyers.
(Click on image to enlarge)

What’s Next For Ethereum?
Ethereum fell below the $4,000 level and now is in an area of uncertainty. If the crypto holds below this level and it begins to act as resistance, then the price may fall back toward the higher low trendline where support has been found in the past. Bulls are looking to see the price recover and push back above the $4,000 level. Bears are looking to see the crypto hold below the $4,000 level and fall back toward the higher low trendline. Bears eventually would like to see the price fall below the higher low trendline.
© 2021 Benzinga.com. Benzinga does not provide investment advice. All rights reserved.


