

Image Source: Pexels
The generals resumed command of the battlefield last week, surging ahead while their lieutenants and troops followed closely behind. But the week’s biggest story wasn’t just price or volume — it was the rapid reversal in market breadth. Allow me to tell you a story of a man name Zweig, says Buff Dormeier, chief technical analyst at Kingsview Partners.
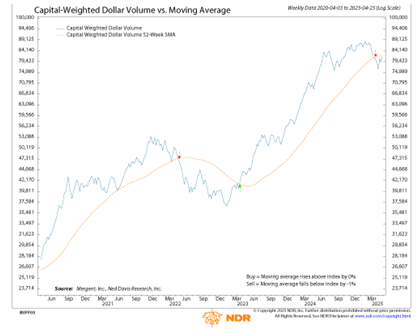
Although the price movement was decisive, volume remained modest. Yet capital flows were overwhelmingly one-sided, with 83% of inflows favoring the upside and 72% of Capital Weighted volume flows surging higher.
Now, let’s talk about the market wizard Marty Zweig. A finance professor by day, a market whisperer by night, Marty preferred data over drama, signals over noise. In the turbulent 1970's, as bear markets and inflationary storms raged, Marty noticed something most ignored: Market breadth — the number of stocks rising versus falling.
While others fixated on the Dow’s headline numbers, Marty theorized that a true recovery meant not only the generals advancing, but also the foot soldiers charging behind them. Out of this insight, he crafted what would become legendary — the Zweig Breadth Thrust (ZBT).
Marty’s ZBT focused on a simple but profound measure: If the average of the advancing-to-advancing-plus-declining stock ratio on the NYSE surged from an oversold state (below 40%) to an overbought level (above 61.5%) within just 10 trading days, it was a powerful sign of internal momentum swinging bullish.
In Marty’s research, this event was exceedingly rare. But when it triggered, it was akin to pulling a slingshot to its limit and suddenly letting go — a potent revival. According to his 1986 book Winning on Wall Street, when a ZBT occurred, the S&P 500 Index (SPX) historically advanced an average of 24.6% over the next 11 months. Marty’s Breadth Thrust was like a wizard’s spell, revealing hidden bullishness when others still trembled with fear.
So, why this story? Because in the second to last week of April, we didn’t just see strong gains — we witnessed a Zweig Breadth Thrust Signal.
At the close of trading on Thursday, April 24, the market officially delivered this rare and bullish indication. The S&P 500 itself has remained trapped in a wide battlefield between 5,600 (ceiling) and 4,800 (floor). But overall, the generals are again charging, the foot soldiers are rallying closely behind, and the ancient wizard Marty Zweig is once again sounding his ZBT trumpet.
About the Author
Buff Dormeier, CMT™ is the chief technical analyst of Kingsview Partners. He provides three important roles to Kingview's clientele that of financial advisor, analyst, and portfolio manager. Armed with proprietary indicators and investment programs, Mr. Dormeier dynamically advises financial advisors, RIAs, as well as affluent and institutional clientele on strategies to help meet their specific investment objectives in uncertain investment climates.
More By This Author:
SLV: Primed For Take-Off As Precious Metals BoomGE: Q1 EPS Tops Forecasts, Management Talks Tariff Plans
Could Bonds Be A Portfolio Savior In These Volatile Times?


Comments
Log in or sign up to join the conversation.