

Image Source: Pixabay
Since 2021, actively managed ETFs have enjoyed the highest percentage growth of any ETF category. Coupled with the huge decline in traditionally structured mutual funds in the same period, it is understandable that active managers who once shunned ETFs as a fad are now offering ETFs and/or converting existing funds to ETFs.
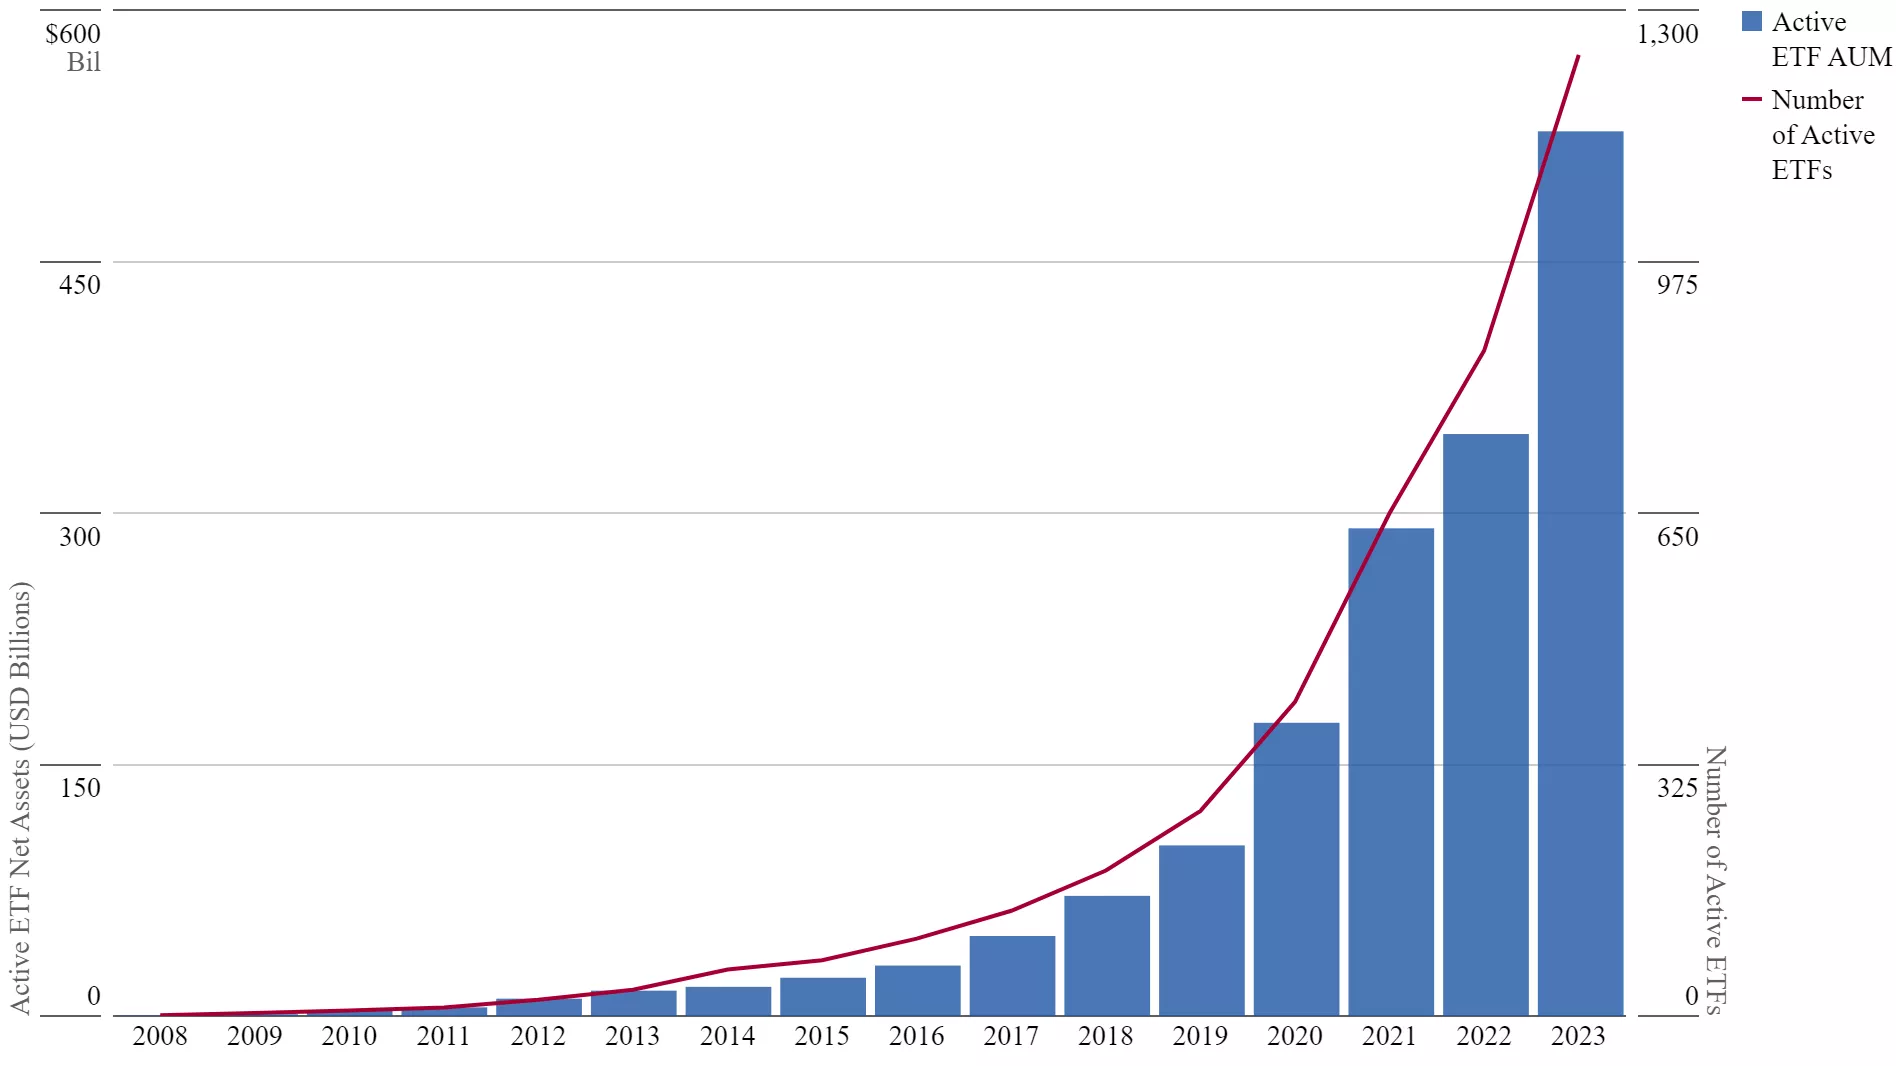
Active ETFs listed globally reached a new milestone in July, with assets under management climbing to $974.3 billion, according to a recent report from London-based ETFGI, an independent research and consultancy firm. The record-breaking figure represents a 32% increase in assets year-to-date, up from $739.9 billion at the end of e2023. In July, actively managed ETFs gathered net inflows of $35.9 billion, bringing year-to-date net inflows to $189.9 billion. It marks the highest year-to-date inflow on record, surpassing the previous high of $86.1 billion set in 2023, ETFGI said.
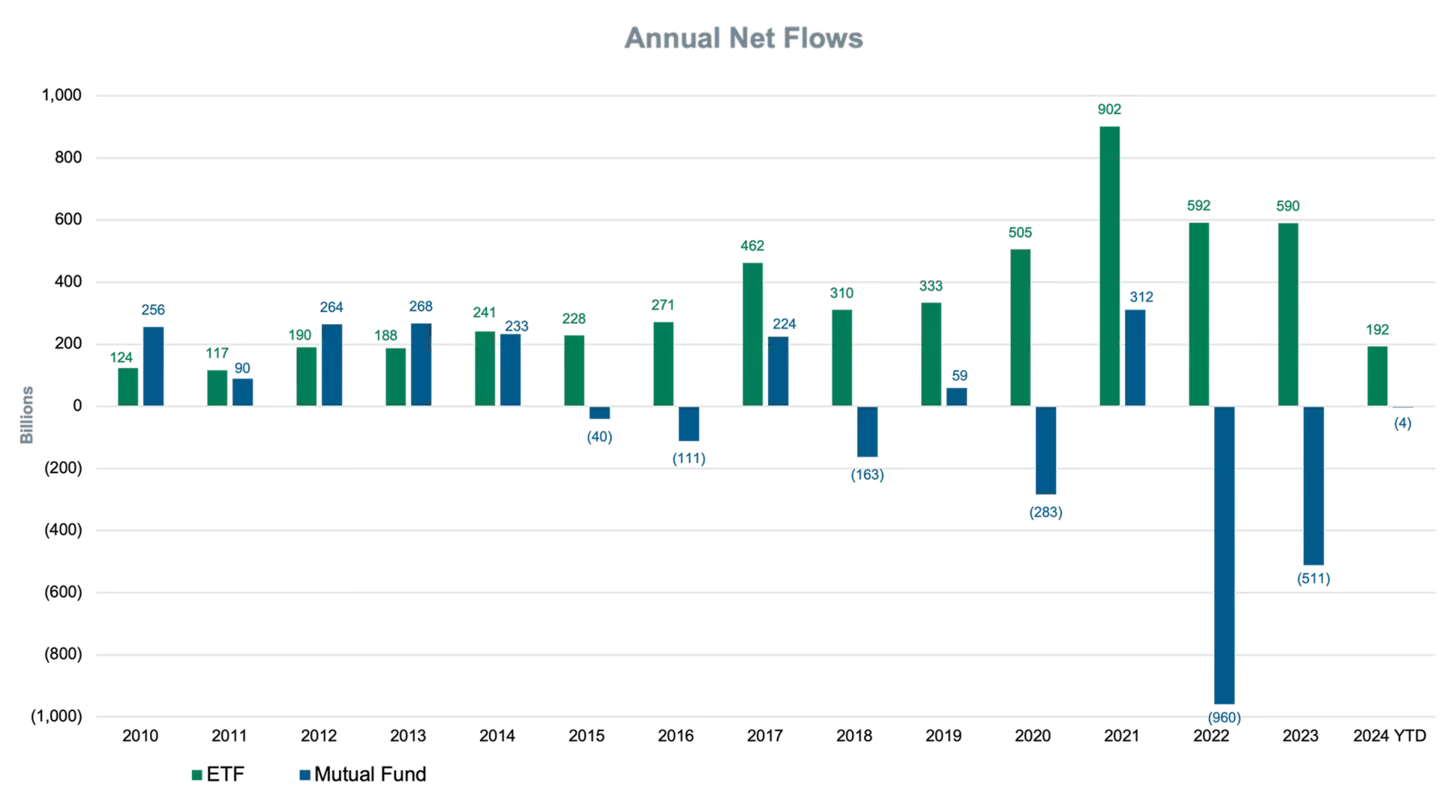
Although the preponderance of ETF assets remains in rules-based index funds, active ETFs' assets have grown at a faster rate. As the last two decades have passed, financial advisors and financial planners have become more aware of the many structural advantages portfolios using the ETF structure have over traditional mutual funds. They are also cognizant of the lower fees and greater transparency that are generally characteristic of ETFs.Many of the assets that have flowed into ETFs have been taken out of traditional funds.
A number of well-known fund families such as American Century and Capital Group began migrating to ETFs for defensive reasons but quickly found other advantages. More recently traditional fund complexes, especially those that have suffered a decline in assets under management (AUM) have come to the realization that the costs in providing ETFs are actually much lower, contrary to previous conventional wisdom, than operating traditional funds. Transfer agency issues all but disappear and portfolio management functions are greatly simplified. Putting cash to work, cash management, and tax-related redemption decisions are virtually eliminated.
The ETF wrapper comes with benefits for active investment strategies:
- Tax efficiency. Mutual funds must buy or sell holdings to cover inflows or redemptions. ETF managers can exchange shares for underlying holdings, and vice versa, without creating a taxable event.
- Low expense ratios. Active ETFs don’t have sales loads or 12b-1 fees. Their average fee (0.65%) is 36% cheaper than that of the average active mutual fund.
- Flexible trading. Investors can buy or sell active ETFs throughout the trading day. They also can go long, sell short, buy on margin, trade options, and lend to others for a fee.
- No cash drag. The traditional mutual fund structure requires ETFs to keep some of their assets in cash for daily redemptions. Investors buying and selling ETFs on exchanges do not affect the assets held by the ETF.
- Selling decisions do not have to take embedded capital gains into account. Since most ETFs do not trade securities on the exchange, there are no embedded capital gains. Traditionally, mutual funds would liquidate shares for redemptions by choosing positions with the most embedded capital gains even though these may represent her/his newest ideas.ETFs allow managers to make selling decisions strictly on investment considerations.
For a full rundown of the many advantages of the ETF structure versus the antiquated redeem-at-distributor mutual fund, see my paper in ValuEngine’s research library here.
This chart illustrates the dramatic shift of mutual fund assets to ETFs.
(Click on image to enlarge)
Another recent development has seen ETF issuers customize funds to meet specialized needs, leading to a wider range of products that draw flows. Managed “buffered” ETFs geared to limit downside losses have become increasingly popular. Market uncertainty is also helping, he said. There is a belief in the market that passive ETFs tend to outperform in stable markets, whereas active management can outperform in volatile, uncertain market conditions.
This chart illustrates the exponential growth of active ETFs.Note the dramatic rise in the slope of the curve in just the past three years. Globally, the number of active ETFs now tops 1200.
(Click on image to enlarge
As of August 23, 2024, 772 active US ETFs were listed on US exchanges. Although that still is less than 30% of the number of more than 3,100 index-based ETFs, that number has grown substantially from the 32 listed in 2019. Here is the breakdown by category of active ETFs.
- Equities 474
- Bonds: 217
- Alternatives: 19
- Commodities: 12*
- Currency (incl. crypto) 10
- Multi-Asset 33
- Preferred Stock 4
- Real Estate 3
The obvious next question is who is issuing these popular ETFs.Let’s start with equities. This table shows many comparative details for the top 22 equity ETFs.
|
|
|
|
|
|
|
The number 15 was chosen to include the ARK Innovation ETF (ARKK), the ETF that established the legitimacy of the category. In 2014, when ARKK was established, the few ETFs in this category were all issued by small firms such as Davis Capital and Trim Tabs Asset Management that had niche followings. Only one had more than $100 million and most of the veterans in the industry laughed at the notion of active ETFs ever gaining traction.ARKK boasted superior research into below-the-radar innovative companies that manifested itself into superior performance. After five consecutive years of outstanding performance, ARKK became internationally noticed along with Founder and CEO Catherine Wood. This drew attention to both active ETFs and the types of innovative technology stocks that were ARKK’s bailiwick. The latter led to increased competition for a small number of midcap stocks that eventually were overbought and the fund’s returns reversed from top decile to bottom quartile. Nevertheless. The impact that ARKK had on the industry should not be forgotten.
Funds 1-21 on the list are all from much larger multinational firms. In fact, four institutionally oriented issuers account for all of them. The four issuers are JP Morgan, Dimensional Fund Advisors, Avantis, and Capital Group. One major difference is that the two JP Morgan funds are oriented toward superior income and avoiding large capital losses while the other funds are all oriented primarily for capital appreciation.
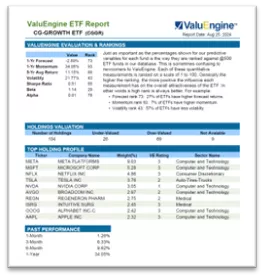
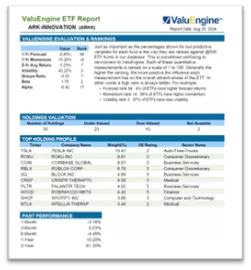
One growth-oriented equity ETF that makes for a good comparison with ARKK is the Capital Group Growth ETF (CGGR). Let’s take a look at part of the first page of the ValuEngine report for each ETF.
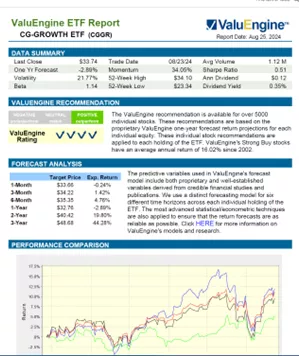
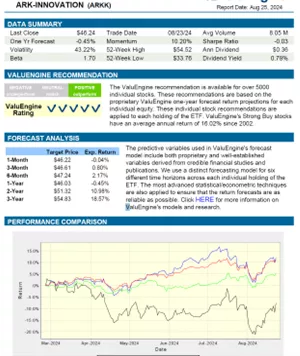
The black lines in the graph represent each ETF performance during the past 12 months. The red line is the S&P 500. The green line is the DJIA. The blue line is the Nasdaq-100.CGGR managed to outperform the S&P 500, no easy feet this year while easily beating the Dow Jones and just slightly underperforming the high-flying Nasdaq. Conversely, ARKK badly outperformed all of the indexes and CGGR by posting a negative return. On a 3-year basis. ARKK, as shown in the original table of ETFs, had an expense ratio close to double that of CGGR, 0.75% as compared with 0.39%. Looking backward, CGGR had been the much better selection.
The ValuEngine ranking system, alternatively, looks forward not backwards.CGGR is expected by our predictive model to outperform the average ValuEngine ETF. We rate it a buy with a 4 rating while the average rating is a 3.ARKK, however, is preferred more by the predictive models as a Strong Buy with a top rating of 5.
The second page of each report provides more material for direct comparisons between CGGR and ARKK.
One insight from this comparison is that when looking at the top ten holdings, the two ETFs only have one stock in common, Tesla (TSLA) which is rated as a Sell with a 2 rating, On the other hand ARKK also contains two 5-rated strong buy stocks in its top ten holdings, Block Inc. (SQ) and Robin Hood Finance (HOOD). Beyond that, our valuation model finds that CGGR has a higher concentration of overvalued stocks.66% or 69/104 of CGGR’s stocks are overvalued according to our valuation model, while only 28%, 10/35, of ARKK’s stocks are overvalued by the same measure. So, although ARKK has taken a beating during the past 5 years, our valuation model and our predictive models both rank it as relatively superior to most other ETFs.If our models are correct, a major rebound could be forthcoming.
In conclusion, there are three major issues with actively managed ETFs as they continue to proliferate with more firms gravitating to the more efficient structure. The first issue is whether it makes sense to choose active management at all when most mutual fund managers have underperformed significantly using the old structure. The answer to that is that it makes sense as long as there are people who feel that active manager oversight has a better chance of navigating stormy investment seas than a top-heavy robotic index weighted primarily according to cash flows. Two, even if they can perform more in line with the indexes using the more efficient ETF structure, does it make sense to pay up-to 0.75% for at best and even chance to outperform when you can but the Vanguard Total Market ETF (VTI) for 0.03%. VTI also has tighter spreads and superior liquidity to any active ETF listed on US exchanges. Three, when will a “tipping point” occur when actively managed funds in the traditional structure all migrate or are replaced by mutual funds using the ETF structure? I do not have an answer for that. As long as the 401K market uses traditional mutual funds exclusively, these funds will continue to exist perhaps for 15 or more years but only the top marketers and top performers are likely to survive in this author’s opinion. There is not a lot of room in the market for mutual fund complexes that continue to hemorrhage assets under management.
More By This Author:
Russell 2000 Small Cap Rebalancing Post-Mortem
Midcap Tech - What Lies Beneath
T + 1 Now A Reality But Why Should I Care?


Comments
Log in or sign up to join the conversation.