

Image Source: Pexels
Charts can fool you. Price action can deceive you. Pretty technical patterns can bankrupt you.
But smart money leaves footprints everywhere. You just need to know where to look.
Yesterday's Healthcare Select Sector SPDR Fund (XLV) collapse proves this perfectly. While chart readers saw bullish setups, the options market screamed danger.
The institutions got it right. The technicians got crushed.
When Clean Charts Hide Dirty Secrets
XLV looked picture perfect on the surface…
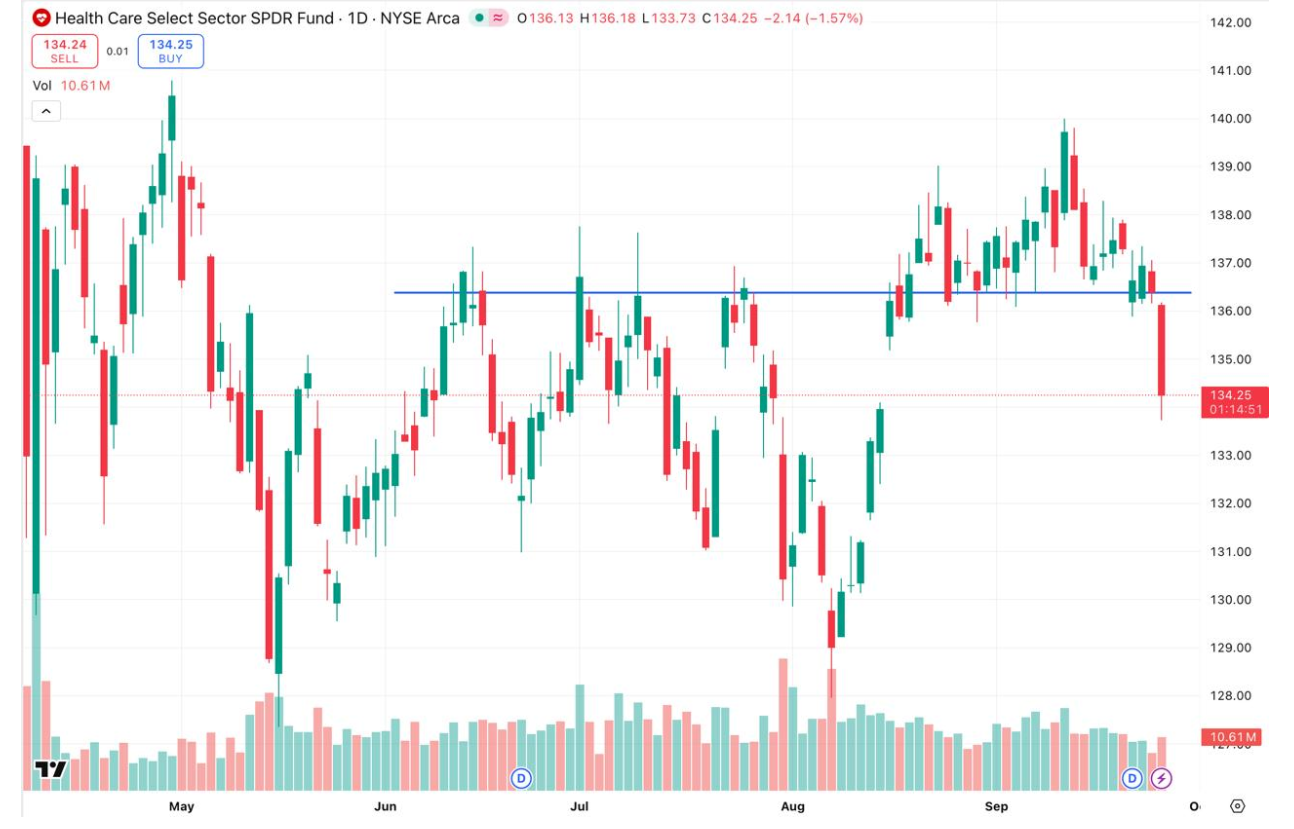
The ETF had broken out in mid-August and was retesting support around $136. Every technical indicator pointed toward another bullish move higher.
Classic textbook setup. Clean support. Prior breakout levels holding. Everything looked ready for healthcare stocks to rally.
But something was brewing beneath the surface. The options market saw what price action couldn't reveal.
Smart money was positioning for disaster.
The $47.5 Million Warning Shot
During Tuesday's main chatroom session, the Ghost Prints Surveillance Console flagged unusual activity that changed everything. Massive institutional flow hit XLV with overwhelming bearish expectations.
The trade: 20,000 January $134 puts bought in one massive print. Simultaneously, 27,500 January $122 puts sold in two separate prints.
This wasn't retail speculation. You don't trade 20,000 contracts on a whim. Large institutions don't throw around $47.5 million positions without serious conviction.
Was it a hedge? Possibly. Does it matter? Absolutely not.
What matters is recognizing when smart money contradicts what your charts are telling you.
The Institutional Advantage
These aren't random trades from desperate retail investors. Institutions have access to information that never shows up on your candlestick charts.
They know about earnings revisions before they're announced. They understand regulatory changes before they hit the news. They see supply chain disruptions before they impact quarterly reports.
Most importantly, they position accordingly.
When institutions deploy this kind of capital against healthcare stocks, they're not guessing. They're operating on intelligence that technical analysis can't capture.
The Collapse Confirms Everything
Instead of the bullish bounce every chart reader expected, XLV broke down hard. The ETF crashed through support and confirmed the bearish thesis that options flow predicted.
The timing wasn't coincidental. Smart money positioned for exactly this move while retail traders bought the "perfect" technical setup.
This massive put spread positioned institutions to profit from healthcare's decline while others lost money chasing false breakouts.
The options market called it perfectly. Charts completely missed it.
Reading Between the Lines
Unusual options activity reveals institutional positioning better than any technical indicator. When you see massive put spreads like this XLV trade, institutions are telling you exactly what they expect.
The beauty lies in following their lead rather than fighting their positioning. They have better information, deeper pockets, and longer time horizons than retail traders.
Smart retail investors learn to read these signals and position accordingly. They stop fighting institutional flow and start profiting from it.
Your Action Plan
Start monitoring unusual options activity before trusting chart patterns. When massive institutional trades contradict technical setups, follow the smart money.
The options market often predicts major moves days or weeks before they happen. Price action catches up eventually, but by then it's too late to position optimally.
Healthcare's collapse was perfectly telegraphed through options flow. The next sector rotation will be too.
Learn to read the signs. Profit while others chase pretty pictures on charts that lie.
More By This Author:
The Market Has Become A Mathematical PrisonWhy Your 20% Returns Must End
I Just Did The Math On Every Bubble Since 1929


Comments
Log in or sign up to join the conversation.