
SPX Monitoring purposes; Long SPX 6/21/23 at 4365.69.
Long SPX on 2/6/23 at 4110.98; Sold 6/16/23 at 4409.59 = gain of 7.26%.
Monitoring purposes GOLD: Long GDX on 10/9/20 at 40.78.
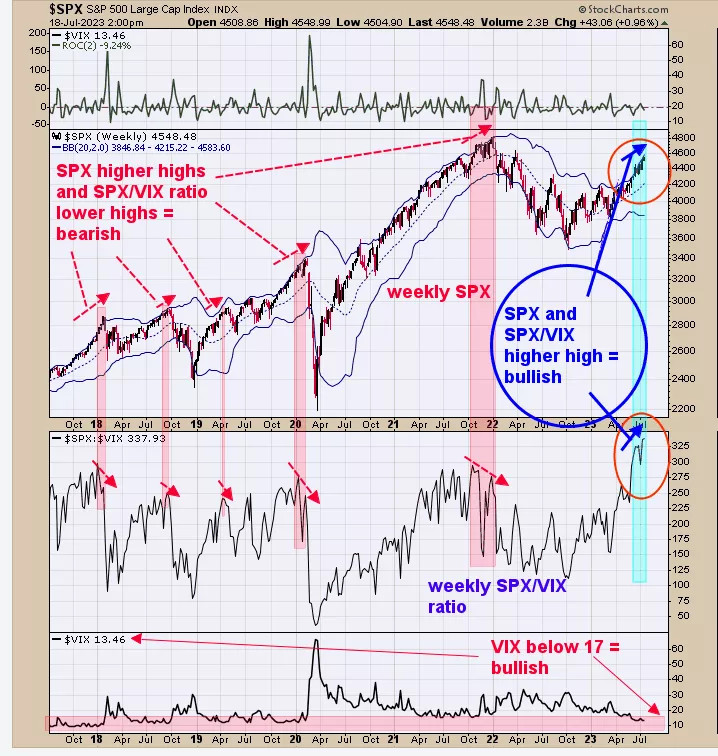
We updated this chart from yesterday and yesterday we said, “The second window up from the bottom is the weekly SPX/VIX ratio. A bearish divergence develops when the weekly SPX makes a higher high and the weekly SPX/VIX ratio makes a lower high (noted in shaded pink). Currently, the weekly SPX has made a higher high along with the weekly SPX/VIX ratio suggesting bullish divergence for the SPX. The bottom window is the VIX and readings below 17 suggest the market is in a trending mode; today’s reading stands at 13.51 and remains bullish. Trend appears up for now.” Today’s VIX reading came in at +13.46. We are showing this chart again because the chart is relevant to what is going on in the market. Signs of a high are near when SPX makes a higher high and SPX/VIX ratio makes a lower high and so far that has not happen.
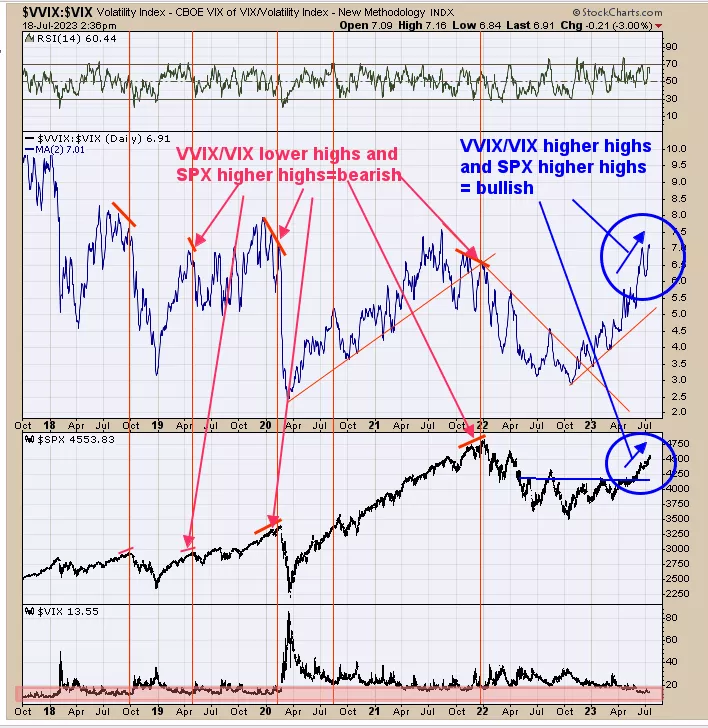
If a bearish divergence is going to show up, the chart above may first to display it. So far no significant divergence is present suggesting the SPX rally can continue. We updated this chart from yesterday, yesterday we said, “The middle window is the daily VVIX/VIX ratio with a 2 period moving average. VVIX responds faster to market movement than the VIX and this ratio can responder faster when a market high nearing. So far the SPX has made higher highs along with the VVIX/VIX ratio and in turn leans bullish. Last Friday the TRIN closed at 1.46 and the tick closed at -629 which is a bullish combination and suggests the market has panic in it to drive the SPX higher short term.” Join us at @OrdOracle
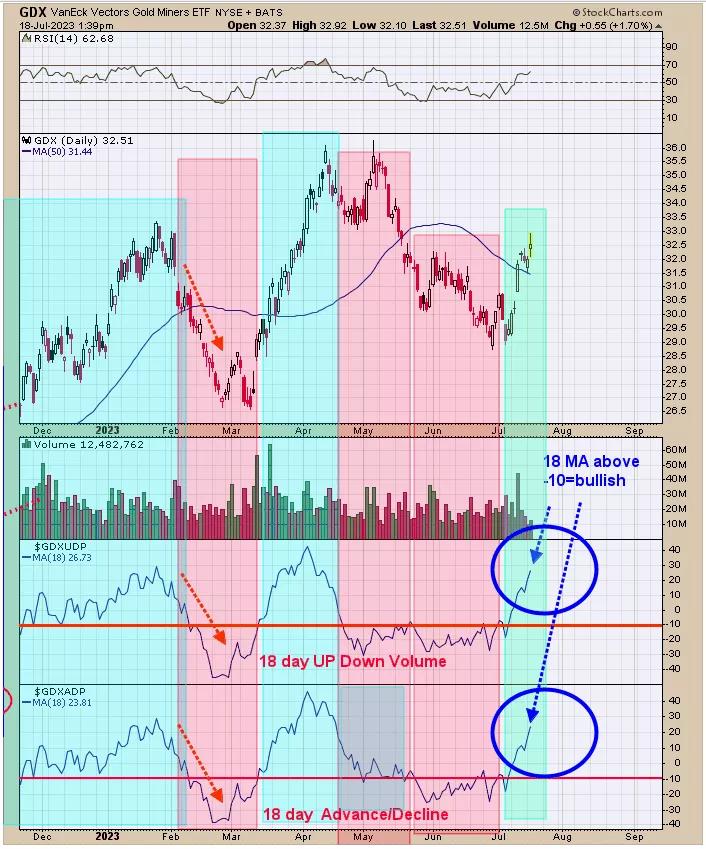
Above is a short term view of what to expect for GDX. The bottom window is the GDX 18 day average of the Advance/Decline percent and next higher window is the GDX 18 day average of the Up down volume percent. When both indicators are above -10 (noted in light blue) a rally in GDX are in progress. As long as both indicators remain above -10 the rally in GDX should continue.
More By This Author:
Market May Be Near A High
An Extended Rally
Upward Trend Remains Intact


Comments
Log in or sign up to join the conversation.