
I have been expecting elevated volatility, and it has surely arrived. The CBOE Volatility Index (VIX) briefly spiked above 35 on 12/3 before settling back down below 20 last week as stocks resurged. Given lofty valuations (S&P 500 at 21.4x forward P/E) that appear to be pricing in continued economic recovery and strong corporate earnings further exceeding expectations, any hint of new obstacles – like onerous new COVID variants, renewed lockdowns, persistent supply chain disruptions, anemic jobs report, or relentless inflationary pressures – naturally sends fidgety investors to the sell button on their keyboards, at least momentarily. And now we learn that the Fed might have joined the legions of dour pundits by removing the word “transitory” from its inflation description while hastening its timetable for QE tapering (but don’t call it QE!) and interest rate hikes. Nevertheless, despite the near-term challenges that likely will lead to more spikes in volatility, investors are buying the dip, and I believe the path of least resistance is still higher for stocks over the medium term, but with a greater focus on quality rather than speculation.
However, investors are going to have to muster up a stronger bullish conviction for the market to achieve a sustainable upside breakout. Perhaps Santa will arrive on queue to help. But with this new and unfamiliar uncertainty around Fed monetary policy, and with the FOMC meeting and announcement this week combined with an overbought technical picture (as I discuss in today’s post below), I think stocks may pull back into the FOMC meeting – at which time we should get a bit more clarity on its intentions regarding tapering of its bond-buying and plan for interest rate hikes. Keep in mind, the Fed still insists that “tapering is not tightening,” i.e., they remain accommodative.
The new hawkish noises from the Fed came out of left field to most observers, and many growth stocks took quite a hit. Witness the shocking 42% single-day haircut on 12/3 for a prominent company like DocuSign (DOCU), for example. And similar things have happened to other such high-potential but speculative/low-quality names, many of which are held by the ARK family of ETFs. In fact, of the 1,086 ETFs scored by Sabrient’s fundamentals-based SectorCast rankings this week, most of Cathie Woods’ ARK funds are ranked at or near the bottom.
Although I do not necessarily see DOCU and its ilk as the proverbial canary in the coal mine for the broader market, it does serve to reinforce that investors are displaying a greater focus on quality as the economy has moved past the speculative recovery phase, which is a healthy development in my view. We continue to suggest staying long but hedged, with a balance between 1) value/cyclicals and 2) high-quality secular growers & dividend payers. Hedges might come from inverse ETFs, out-of-the-money put options, gold, and cryptocurrencies (I personally hold all of them).
In this periodic update, I provide a comprehensive market commentary, offer my technical analysis of the S&P 500 chart, review Sabrient’s latest fundamentals-based SectorCast quant rankings of the ten US business sectors, and serve up some actionable ETF trading ideas. To summarize, our SectorCast rankings reflect a highly bullish bias, with the top two scorers being deep-cyclical sectors, Basic Materials, and Energy, which are seeing surging forward EPS estimates and ultra-low forward PEG ratios (forward P/E divided by projected EPS growth rate) under 0.50. In addition, the technical picture is somewhat mixed and suggestive of a near-term pullback, although our sector rotation model maintains its bullish posture.
Commentary:
Last December 2020, I forecasted for 2021 that, “…absent another exogenous shock, I think the reopening trade is sustainable and the historic imbalances in Value/Growth and Small/Large performance ratios will continue to gradually revert and market leadership broadens, which is good for the long-term health of the market. The reined-in economy with its pent-up demand is ready to bust the gates, bolstered by virtually unlimited global liquidity and massive pro-cyclical fiscal and monetary stimulus here at home (with no end in sight), as well as low interest rates (aided by the Fed’s de facto yield curve control), low tax rates, rising inflation (but likely below central bank targets), and the innovation, disruption, and productivity gains of rapidly advancing technologies. And although the major cap-weighted indexes (led by mega-cap Tech names) have already largely priced this in, there is reason to believe that earnings estimates are on the low side for 2021 and stocks have more room to run to the upside. Moreover, I expect active selection, strategic beta ETFs, and equal weighting will outperform…. In other words, we believe ‘the stars are aligned’ for additional upside in the US stock market – as well as in emerging markets and alternatives (including hard assets, gold, and cryptocurrencies).”
So, how did that forecast turn out? As for asset class performance, with the notable exceptions of gold and emerging markets, I was mostly on the money. In the case of inflation, it has risen considerably higher than I anticipated, although I still expect YoY growth readings to moderate by mid-to-late 2022 with higher base period comps and improving supply shocks. For example, oil has already seen a solid pullback from the October highs (above $80), critical energy shortages and port capacity limits in Asia are easing, unprecedentedly high ocean freight rates have receded, and China has restored manufacturing to close to normal capacity since October.
However, if supply chains remain largely disrupted for an extended period, such as due to renewed lockdowns in the big manufacturing regions due to a COVID mutation scare, it would hasten the onshoring of manufacturing that is already underway, particularly in pharmaceuticals, semiconductors, and consumer goods. China and India today have nearly complete control of the drugs Americans take, while most chips are made in Asia (including Taiwan, South Korea, Singapore, China, Malaysia, and Japan) for our smartphones, watches, laptops, game consoles, cars, and robotics, among many other critical products.
Indeed, we are already seeing a lot of capital flowing to not only bring manufacturing back to America for security and economy reasons, but also to leverage decentralized manufacturing for just-in-time inventory management and reduce reliance on highly sophisticated (and increasingly costly and disruptable) shipping and logistics. For example, Samsung recently announced that it will be investing $17 billion in a new chip plant in Texas, and chip juggernaut Taiwan Semiconductor (TSM) is building a $12 billion fabrication facility in Arizona to produce 20,000 wafers per month, and the electric vehicle (EV) makers are building decentralized car and battery plants closer to the end markets.
Inflation and interest rates:
The big news of course was the +6.8% YoY inflation print for November. Among the biggest contributors were gasoline (+58.1%), natural gas (+25.1%), used cars and trucks (+31.4%) and clothes (+5.0%). Yes, demand is back above pre-pandemic levels, but it isn’t excess demand that is driving price spikes. The US dollar is quite strong, the jobs market and participation rate are far from maximum employment, and capacity utilization remains well below the critical 80% threshold (around 76%). Supply simply can’t keep up with the rapid resumption of pre-pandemic demand because of persistent supply chain disruptions across the full product fulfillment spectrum of manufacturing, transportation, logistics, energy, and labor. Much has been made about M2 money supply approaching $21.2 trillion, but much of it sits idle on the sidelines, which is why the multiplier is so low (about 1.12x) and the “too much money supply” argument falls short. Total US money market fund assets continue to sit around $4.6 trillion, and total cash deposits in banks are about $17 trillion. Some learned commentators are opining that rather than rebuild our old supply chains, they will come back more slowly but completely remade with “America 3.0” methods and technologies.
I can’t say I blame stock and bond investors for continuing to shrug off these inflation readings. I have written in great detail in my July and September posts with my reasoning for why I think inflationary pressures likely will moderate in 2022 as supply chain issues continue to resolve, labor returns to work, velocity of money stock remains low, the dollar retains strength as a global safe haven, and capacity utilization stays below the worrisome threshold, plus the long-term secular trends of aging demographics, slowing global population growth, re-globalization of trade and supply chains (albeit with some onshoring of manufacturing to reduce reliance on adversarial countries), and the unstoppable force of disruptive innovation.
For now, real interest rates remain firmly in the negative – e.g., subtract the +6.8% inflation print from a 1.49% 10-year Treasury nominal rate and you get -5.3% real return by holding a 10-year Treasury note. So, what gives? Well, it might suggest investors believe rising real rates would cripple our heavily indebted economy and the stock market, and so the Fed must be talking down rates well in advance of any actual rate hikes. Indeed, return of capital might be a better choice on low-risk capital than riskier return on capital.
But as Eric Peters of One River Capital points out, the problem with this is that “fiscal policy sees it as an opportunity. Negative real interest rates are being treated as an invitation to expand mandates and increase spending policies.” They are talking about Congress. Indeed, global debt is approaching $300 trillion. US national debt will soon breach $30 trillion, with our debt-to-GDP ratio currently at 126%, as compared to 35% in 1980 and 56% in 2000 – albeit interest rates and borrowing costs were much higher then, so debt servicing costs-to-GDP are still at historical levels. But government spending currently exceeds tax revenue by $3 trillion a year, with Congress trying to pass even more massive spending bills, such that the Fed must print about $3 billion/day and lend it to member banks.
Regardless of whether we have real monetary inflation or simply the lingering effects of transitory supply disruptions, keep in mind that inflation doesn’t kill economic growth on its own. Rather, it is a surge in interest rates (aka borrowing costs), not just a modest increase. And perhaps more importantly, as market maven Alexander Green opined, we must avoid the destructive “regulatory and redistributive policies that will reduce innovation, lessen productivity and undermine the economy.”For my part, I still believe we are in the early stages of a “Roaring ‘20s redux” from 100 years ago, with only modest inflation and an extended expansionary economic cycle, so long as misguided political leaders – and the noisy legion of malcontents who egg them on – don’t screw it up.
GDP and corporate earnings:
GDP growth has been robust this year, with Q1 2021 coming in at an annualized YoY rate of +6.3%, Q2 at +6.7%, and Q3 (second estimate) at +2.1%. Looking ahead, the Atlanta Fed’s latest GDPNow estimate was just revised upward to a stunning 9.7% annual rate, up from its previous estimate of 8.6%. Turning to corporate earnings, S&P Global reported for Q3 2021 that 59% of the S&P 1500 Composite Index constituents surpassed EPS expectations versus S&P Capital IQ estimates, with a blended EPS growth rate of 25%. Almost 90% of Financial and Information Technology firms exceeded expectations. Furthermore, nearly 75% of firms beat S&P Capital IQ revenue estimates. Financials and Information Technology sectors led the pack with 89% of firms surpassing estimates, with a blended revenue growth rate of 21%.
According to FactSet, analysts are forecasting S&P 500 earnings growth for full-year 2021 will end up at about +45%, due to a combination of higher earnings and easier comparisons to lower earnings from 2020. For 2022, however, analysts are expecting slightly lower but still solid earnings growth of 9.0% on revenue growth of 7.3%. Ten of the 11 sectors are projected to report year-over-year growth in earnings, led by Industrials (+35.9%), Consumer Discretionary (+32.2%), and Energy (+28.4%), with Financials the lone sector expecting a decline in earnings (-8.9%) in 2022. (In case you’re curious, InfoTech is expected to show +9.8% EPS growth.) As for the revenue line, all 11 sectors are expected to show YoY growth, led by the Consumer Discretionary (+14.1%) and Industrials (+11.4%).
For 2022, FactSet’s bottom-up EPS estimate for the S&P 500 (which reflects an aggregation of the median EPS estimates for CY 2022 for all companies in the index) is $222.71. Over the past 25 years, industry analysts on average have overestimated the final EPS number by 7.2% one year in advance. However, lately it seems analysts have been much more conservative with their estimates given the many uncertainties.
Equity valuations:
Despite elevated volatility, worrisome inflation prints, and a new hawkish tone from the Fed, stocks remain on-track for another stellar year (up +25.9% through 12/10/2021), which would be the third year in a row of double-digit gains for the S&P 500, following returns of +31.2% in 2019 and +18.4% in 2020. In fact, since the Financial Crisis recovery began in 2009, there has been only one slightly negative year for the S&P 500, which was in 2018 (-4.4%) when sentiment turned defensive primarily due to the trade war with China, leading to the nasty Q4 selloff. But the price chart since the speculative pandemic recovery launched in March 2020 has gone essentially vertical – which of course cannot go on forever at such a rate.
Nevertheless, in my view, investors are increasingly demanding solid earnings quality and more attractive valuations, and if you disappoint on earnings or guidance, your stock might tank. Yes, the mega-cap-dominated S&P 500 is trading at a valuation premium to pre-pandemic levels (S&P 500 at 21.4x next 12 months forward earnings). But the rest of the stock world (including US small and mid-caps) are at much lower valuations, as are the equal-weight versions of the broad indexes. The good folks at DataTrek Research have observed that this is due to: 1) the proven ability of the mega-cap juggernauts to beat analysts’ consensus earnings estimates ($240/share is their base case for the S&P 500 in 2022 versus the FactSet bottom-up estimate of $222), and 2) the massive overweight in Tech and near-Tech companies, with 29% formally categorized as Tech and another 13% from the likes of Amazon.com (AMZN), Alphabet (GOOG), Tesla (TSLA), and Meta Platforms (aka Facebook, FB). That’s 42% of the index.
So, the elevated multiples in the SPY and Invesco Nasdaq 100 (QQQ) are driven by these popular mega-cap stocks such that bullish conviction at this point should come from all the other (often neglected) opportunities that offer high quality at much more attractive valuations. Indeed, I’ve seen some pundits calling for 2022 to be the “dawn of a golden age” for value, while others say growth stocks historically do quite well during modestly rising rates. Net-net, I think this supports our view to hold a balance of both.
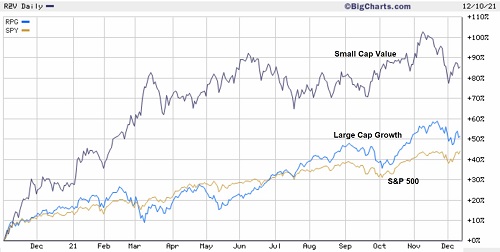
Let’s take a quick look at a YTD chart of the Invesco S&P 500 Large Cap Pure Growth ETF (RPG) versus the Invesco S&P 600 Small Cap Pure Value ETF (RZV). The big value rotation actually kicked into gear on 11/1/2020, and it continued in earnest into mid-March. Since then, however, growth has been gradually trying to catch up, but small value still enjoys an approximate 35pp lead.
Potential risks:
For now, investors continue to grapple with a worrisome combination of high equity valuations, new COVID variants, slow recovery in supply chains, ongoing labor shortages, and China’s growth slowdown (while deleveraging its real estate sector and cracking down on what President Xi perceives as the “excesses” of free-market economics), all of which have combined to create stickier inflationary pressures than expected – and, as a result, unfamiliar uncertainty in what had long been a sure bet, i.e., Fed monetary policy. So, elevated volatility is likely to persist because, historically, a hawkish Fed has led to lower growth in money supply growth, tighter financial conditions, lower economic growth, and lower equity multiples. I would summarize the risks as follows:
- Double-dip global recession from vaccine-resistant COVID mutations or unbalanced labor markets
- China’s financial issues grow, leading to tighter monetary policy there and slower global growth
- Sustained inflation surge makes the Fed turn hawkish, leading to rising interest rates for indebted economy
- Corporate earnings growth fails to achieve levels necessary to justify high valuations
- Escalation in financial/technological/military conflicts with China and global hegemony (growing risk)
- US dollar meltdown due to massive stimulus and loss of “safe haven” status (low risk)
- The process of deleveraging a heavily indebted global economy (longer-term issue)
Indeed, it appears China is allowing some defaults from Evergrande rather than doing their usual bailout/monetization. However, it’s highly unlikely Evergrande will default on all $300 billion of its total liabilities, which would destroy the savings of most Chinese and hobble the global economy. The problem is, however, Evergrande is not the only over-leveraged developer that is in trouble. Xi has his hands full on this issue, but of course any major fallout will not be limited to within China’s borders.
Regarding the COVID variants, interestingly, some observers have suggested that a more transmissible (and less deadly) variant like Omicron may help the broader population get to herd immunity faster. In addition, new therapeutics have been developed that seem to offer strong efficacy. If this all pans out, it surely will hasten a return to normalcy and recovery of supply chains, labor markets, travel, and economic growth.
Final comments:
Looking ahead, equity valuations remain lofty even after the latest spike in volatility, although they are bolstered by robust corporate earnings growth; massive global liquidity; negative real interest rates; massive share buybacks (close to $1 trillion by year-end!); a surge in corporate CAPEX (for automation, onshoring, and decentralized manufacturing); and a lack of good alternatives (aka “TINA”) – which should persist unless the Federal Reserve turns overly hawkish to squash the inflationary pressures and raise interest rates too aggressively (the classic policy mistake by which all recessions are born). I still expect inflation is on course to moderate in 2022 as supply chains recover, bottlenecks and labor shortages resolve, the labor participation rate starts to rise again, and disinflationary structural trends resume, e.g., aging demographics, rising productivity, technological disruption, and automation.
Moreover, the likes of blockchain, metaverse (Facebook even changed its name!), electric vehicles, genomics, space exploration, 5G, IoT, Big Data, AI/ML, Web 3.0, cloud computing, digitization, video conferencing, augmented/virtual reality (AR/VR), computer vision (CV), gaming, networks, sensors, 3-D printing, robotics, sustainability, clean fuels, green/renewable energy, nuclear fusion, cybersecurity, DeFi, fintech, nanotech, biotech, telehealth, precision medicine, computational biology, and biologics are all rapidly changing the world as we know it.
For 2022, I expect greater volatility and perhaps a rather significant market correction. It will be largely dependent on the political tone during election campaigning heading into the mid-term elections. I expect reduction in inflationary pressures, and a firming in Treasury prices (currently catching a strong bid at 1.6-1.7%, and likely remaining below 2% on the 10-year in 2022). Although gold may well remain the proverbial “red-headed stepchild,” I still suggest holding it (and crypto) as a hedge against things going terribly wrong in these unprecedented times.
In addition, my expectation for the New Year is that investors will demand that companies justify their valuations with strong earnings growth, rising forward guidance, and solid earnings quality, which likely implies higher performance dispersion (rather than all-boats-lifted) that should benefit active management and long/short strategies.
SPY Chart Review:
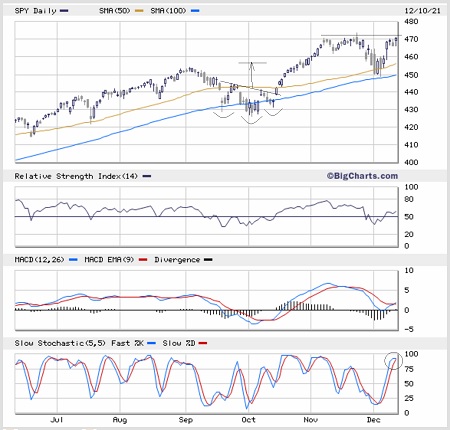
The SPDR S&P 500 Trust (SPY) closed Friday just below 471. The start of December brought another successful test of support at the 100-day simple moving average (SMA), but there still hasn’t been a test of the 200-day SMA since June 2020 (during the initial pandemic recovery). In my October post, I pointed out the bullish “reverse head & shoulders” pattern that appeared to be forming, with a target at about 456 as shown, and indeed it played out as price achieved that level later in the month, consolidated for a few days, and then broke out in November to new highs. Looking at the oscillators, RSI and MACD are in neutral positions, but Slow Stochastic is looking overbought and ready to rollover. SPY closed Friday with a bearish “hanging man” candlestick, and with the all-time high (ATH) from November just above at 473.54, it appears there might be a “triple-top” resistance forming. My guess is that SPY pulls back (to perhaps 460) into the important 12/15 FOMC meeting and then eventually proceeds with the seasonal Santa Claus rally into year-end. Notably, the Nasdaq 100 (QQQ) has a similar setup, perhaps due to its similar dominance by mega-caps (which investors have been looking at as “defensive” positions), but the Russell 2000 small cap (IWM) is looking much weaker.
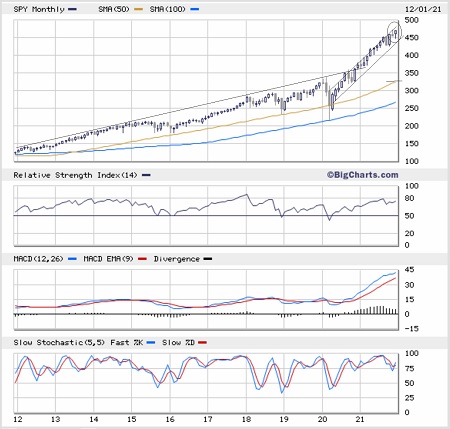
In addition, if you pull up a 10-year monthly chart of SPY, as shown below, you can see the striking near-vertical uptrend line coming off the pandemic selloff as compared to the previous (and much flatter) long-term trendline – and how ominously stretched it remains from its 50-month SMA, as I pointed out in October. I will repeat what I said then, i.e., this vertical move can’t go on indefinitely, and price will someday retest support at the moving averages. Note that November formed a bearish “shooting star” pattern, and so far (through 12/10), December is showing a bearish “hanging man” pattern. This doesn’t necessarily portend a harsh correction, as it may instead consolidate (with elevated volatility) at some point to allow the moving averages to catch up.
Latest Sector Rankings:
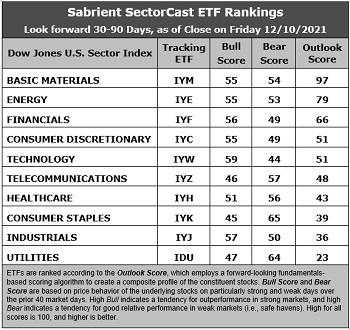
Relative sector rankings are based on our proprietary SectorCast model, which builds a composite profile of each of over 1,000 equity ETFs based on bottom-up aggregate scoring of the constituent stocks. The Outlook Score employs a forward-looking, fundamentals-based multifactor algorithm considering forward valuation, historical and projected earnings growth, the dynamics of Wall Street analysts’ consensus earnings estimates and recent revisions (up or down), quality and sustainability of reported earnings, and various return ratios. It helps us predict relative performance over the next 2-6 months.
In addition, SectorCast computes a Bull Score and Bear Score for each ETF based on recent price behavior of the constituent stocks on particularly strong and weak market days. A high Bull score indicates that stocks within the ETF recently have tended toward relative outperformance when the market is strong, while a high Bear score indicates that stocks within the ETF have tended to hold up relatively well (i.e., safe havens) when the market is weak.
Outlook score is forward-looking while Bull and Bear are backward-looking. As a group, these three scores can be helpful for positioning a portfolio for a given set of anticipated market conditions. Of course, each ETF holds a unique portfolio of stocks and position weights, so the sectors represented will score differently depending upon which set of ETFs is used. We use the iShares that represent the ten major U.S. business sectors: Financials (IYF), Technology (IYW), Industrials (IYJ), Healthcare (IYH), Consumer Staples (IYK), Consumer Discretionary (IYC), Energy (IYE), Basic Materials (IYM), Telecommunications (IYZ), and Utilities (IDU). Whereas the Select Sector SPDRs only contain stocks from the S&P 500 large cap index, I prefer the iShares for their larger universe and broader diversity.
Here are some of my observations on this week’s scores:
1. The rankings continue to look bullish, topped by deep cyclicals Basic Materials and Energy with impressive Outlook scores of 97 and 79, respectively, which is virtually unchanged from October. You would expect strength in these cyclical sectors given their high earnings leverage within an expansionary economy and solid oil and commodity prices. Basic Materials displays the best analyst sentiment (recent positive net revisions to EPS estimates), a low forward P/E of 12.0x, surging projected EPS growth (26.4%), and an ultra-low forward PEG (forward P/E divided by projected EPS growth rate) of 0.45. Energy enjoys strong analyst sentiment, the lowest forward P/E of 11.1x, stellar projected EPS growth (25.9%), and the lowest forward PEG of only 0.43. I can’t emphasize enough how low these forward PEGs are compared to many prior years of SectorCast rankings. After dwelling in or near the cellar for much of the past few years, Energy has climbed the ladder this year and is now as firmly entrenched at the top as much as it was previously entrenched at the bottom for so long – particularly given that oil prices have held strong. Rounding out the top five are Financial, Consumer Discretionary, and Technology, which is quite the bullish group.
2. At the bottom are Utilities and Industrials with Outlook scores of 23 and 36, respectively, while Consumer Staples isn’t too far ahead at 39. Utilities is a low (but stable) growth sector that should score low in a surging economy, while Industrials appear to be a bit overbought with a high forward P/E (22.7x), likely due to infrastructure spending speculation, although it displays solid earnings growth expectations.
3. Looking at the Bull scores, Technology has the top score of 59, followed by Industrials at 57, as stocks within these sectors have displayed relative strength on strong market days. Telecom scores the lowest at 46. The top-bottom spread is quite low at only 13 points, which reflects high sector correlations on strong market days. It is desirable in a healthy market to see low correlations reflected in a top-bottom spread of at least 20 points, which indicates that investors have clear preferences in the market segments and stocks they want to hold, so this is a bit of a near-term concern.
4. Looking at the Bear scores, Consumer Staples scores the highest of 65, followed by Utilities at 64, as stocks within these defensive sectors have been the preferred safe havens on weak market days. Technology displays the lowest score of 44, as investors have fled the sector during market weakness. The top-bottom spread is 20 points, which reflects low sector correlations on weak market days. Ideally, certain sectors will hold up relatively well while others are selling off (rather than broad risk-off behavior), so it is desirable in a healthy market to see low correlations reflected in a top-bottom spread of at least 20 points.
5. Basic Materials displays the best all-around combination of Outlook/Bull/Bear scores, while Utilities is the worst. Looking at just the Bull/Bear combination, the best balance is displayed by Basic Materials and Energy, indicating superior relative performance (on average) in extreme market conditions whether bullish or bearish.
6. This week’s fundamentals-based Outlook rankings display a highly bullish bias given that the top 5 sectors are considered either cyclical (Materials, Energy, Financial, Discretionary) or all-weather (Technology), while the more defensive sectors (particularly Utilities and Staples) are relegated to the bottom. Keep in mind, the Outlook Rank does not include timing, momentum, or relative strength factors, but rather reflects the consensus fundamental expectations at a given point in time for individual stocks, aggregated by sector.
ETF Trading Ideas:
Our Sector Rotation model, which appropriately weights Outlook, Bull, and Bear scores in accordance with the overall market’s prevailing trend (bullish, neutral, or defensive), continues to display a bullish bias and suggests holding Basic Materials (IYM), Technology (IYW), Energy (IYE), in that order. (Note: In this model, we consider the bias to be bullish from a rules-based trend-following standpoint when SPY is above both its 50-day and 200-day simple moving averages.)
If you prefer a neutral bias, the Sector Rotation model suggests holding Basic Materials, Energy, and Financials (IYF), in that order. Or, if you are more comfortable with a defensive stance, the model suggests holding Consumer Staples (IYK), Utilities (IDU), and Basic Materials, in that order.
An assortment of other interesting ETFs that are scoring well in our latest rankings include: VanEck Vectors Steel (SLX), First Trust Indxx Global Natural Resources Income (FTRI), Fidelity Stocks for Inflation (FCPI), Alpha Architect US Quantitative Value (QVAL), AdvisorShares Dorsey Wright ADR (AADR), SPDR S&P Homebuilders (XHB), ProShares Nanotechnology (TINY), WBI BullBear Quality 3000 (WBIL), VanEck BDC Income (BIZD), First Trust Materials AlphaDEX (FXZ), First Trust Nasdaq Semiconductor (FTXL), ETFMG Treatments Testing and Advancements (GERM), Cambria Value and Momentum (VAMO), QRAFT AI-Enhanced US High Dividend (HDIV), LeaderShares AlphaFactor US Core Equity (LSAF), iShares MSCI Global Energy Producers (FILL), FlexShares Quality Dividend Dynamic (QDYN), Invesco S&P 500 Equal Weight Energy (RYE), Pacer US Cash Cows 100 (COWZ), Pacer US Small Cap Cash Cows 100 (CALF), Davis Select Financial (DFNL), AdvisorShares Alpha DNA Equity Sentiment (SENT), Alerian MLP (AMLP), and Innovator IBD Breakout Opportunities (BOUT).


Comments
Log in or sign up to join the conversation.