
Two Non-Generic ETFs For A Potential Small-Cap Driven Market
If, in fact, small-caps really are moving into the market driver’s seat, that would be a major development, particularly in what this says about risk tolerance. So let’s consider the potential for this to be a sustainable thing (subject, as with everything else, to the ebb and flow of Presidential tweets), and, if it is, what ETF plays we might consider.
We Don’t Want To Get Caught Up In The Moment
Small caps are definitely looking better than they were back on August 28, when I wrote about “What It Will Take For Small-Capitalization Stocks And ETFs To Shine.” That article included a screen-shot from our dashboard showing the percentage of ETFs rated favorably, neutrally, or unfavorably, in each of the size categories. Here is what we showed back then.
Figure 1
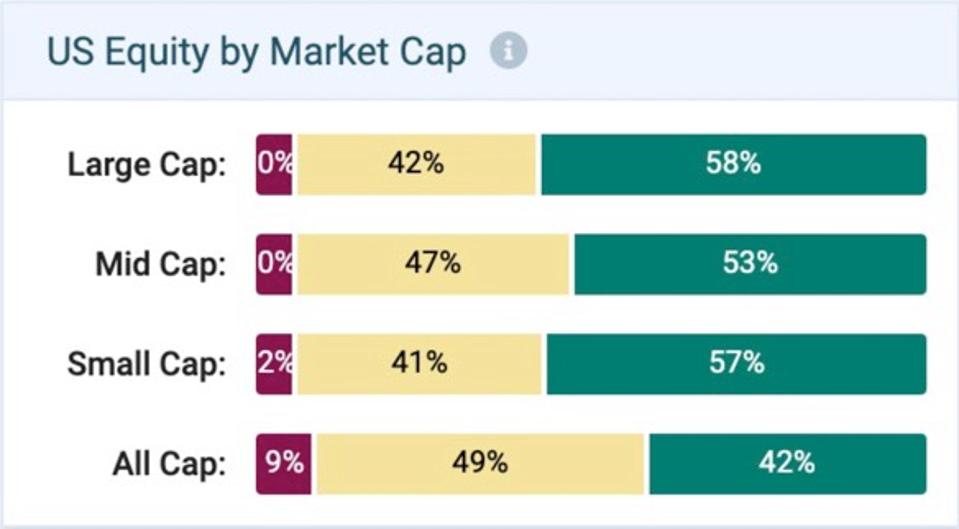
Images from PortfolioWise - Powered by S&P Global Market Intelligence/ClariFi
Small-cap data back then wasn't horrible, but it certainly was not yet ready to revel in applause. Here’s where we are now.
Figure 2
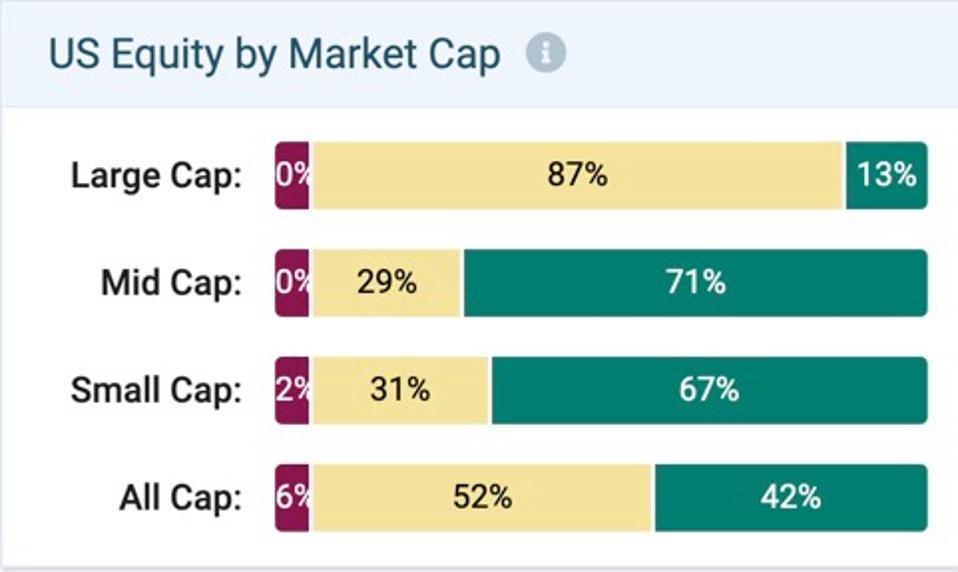
Images from PortfolioWise - Powered by S&P Global Market Intelligence/ClariFi
This is a distinct improvement. What’s really noteworthy here is that we’re not depicting performance tallies of ETFs. We’re showing the distribution of our forward-looking Power Ranks. So this could be seen as supporting a “go” decision on small-caps.
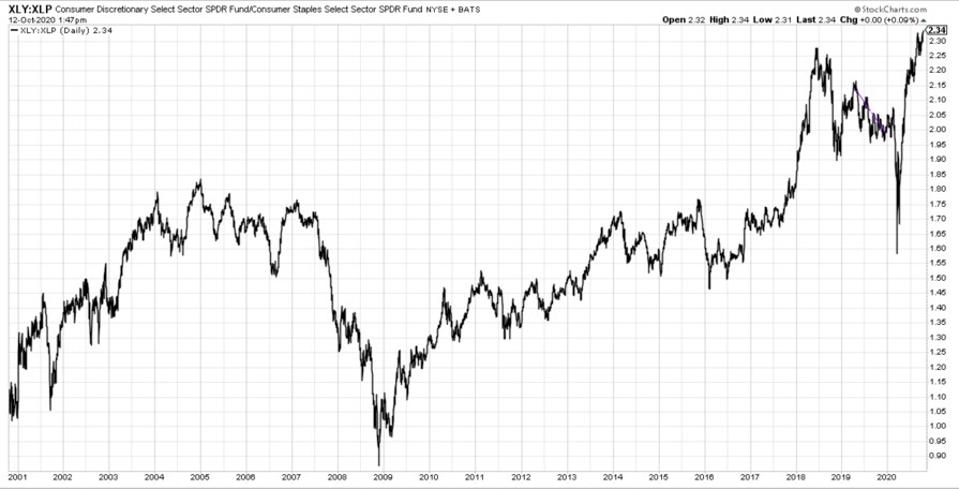
However, we’ve been faked out before. Consider the recent (one-year) performance of small-caps relative to large-caps.
Figure 3
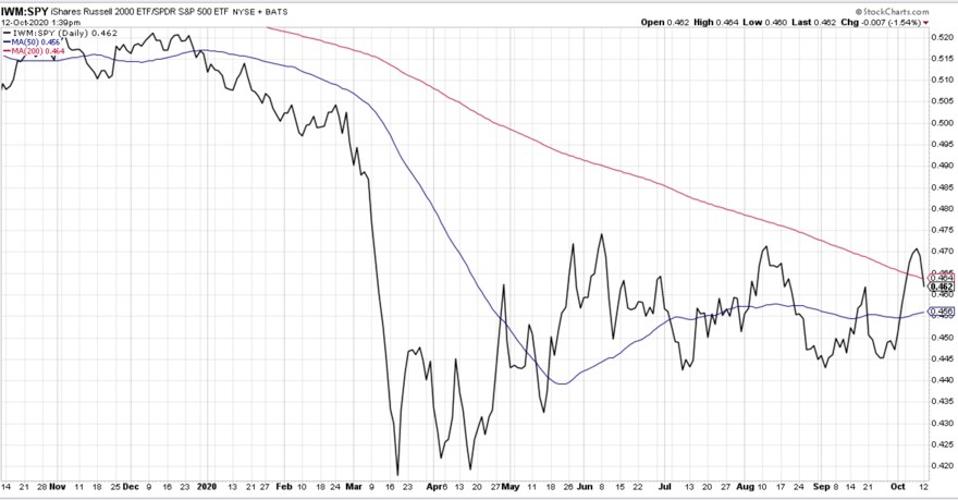
STOCKCHARTS.COM
But lest we get too excited, we should check the longer (20-year) view, and note that the period large-cap relative strength was long-lasting and substantial.
Figure 4
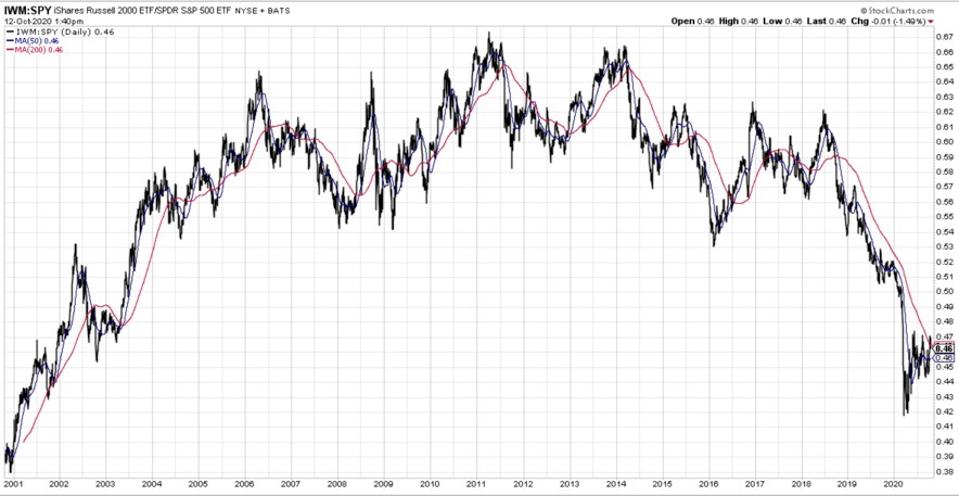
STOCKCHARTS.COM
My take here is that it will require more than chart study alone and more than a couple of months' worth of data to justify going all in on small-caps.
We Need To Look At The Performance Drivers In Order To Justify A More Confident Outlook
This is where conventional quantitative analysis falls down. Studying data relating to the traditional Fama French “SMB” (Small minus Big) factor/portfolio, or whatever other names researchers may have given it, is a guaranteed slow boat to nowhere since you’ll only learn what happened at various times in the past. You’ll get no clue about potential future scenarios.
Whether small-cap data outperforms or underperforms is always a fundamental phenomenon. Fundamentally speaking, are small caps more of less desirable than large caps (at the relevant points in time)?
In my August 28 post, I explained that small companies and large companies are inherently different due to operating leverage (the role of fixed costs) and lesser levels of internal diversification. While one can always find exceptions to any general rule, the overarching principal here is that small-cap investing is inherently associated with higher levels of business risk. (At least that’s the starting presumption; the burden of proof in a specific instance would be on one who wants to argue the other way).
As I noted in August, the main case for small-cap relative strength is based on the notion that the market has become more willing to take bigger risks.
If You Want To Go-Small-Or-Go-Home You Will Need A Bullish View Of Future Economic Activity
We already see from recent price trends that the market has become willing to adopt a risk-on stance. In assessing the market’s potential willingness to continue to do likewise for a more prolonged period, we have to assess the likelihood that investors will get burned by having bigger allocations to shares of companies whose results will be hit harder if business conditions deteriorate.
The flip-side of the suffer-more-in-bad-times-phenomenon is that when times are good, business trends for these companies tend to show more upside (the good kind of) volatility.
Forecasting the economy is a challenge. There’s a reason why economics is referred to as “the dismal science.” So I’ll leave interest rates, GDP, employment statistics, inventory data, trade numbers, etc. to those who have degrees relating to that sort of thing. They may not always be right, but I can’t imagine myself out-analyzing them.
I’ll focus instead on our stock in trade; reading the market, the sort of wisdom-of-the-crowds approach that supports sentiment, momentum, technical analysis etc. spiced with some company fundamentals. Figures 1 and 2 were based on this, given that the green plots represent the results of a forward-looking model. Further along those lines, Figure 5 shows how the 11 sector-focused SPDR ETFs rank in our model.
Figure 5
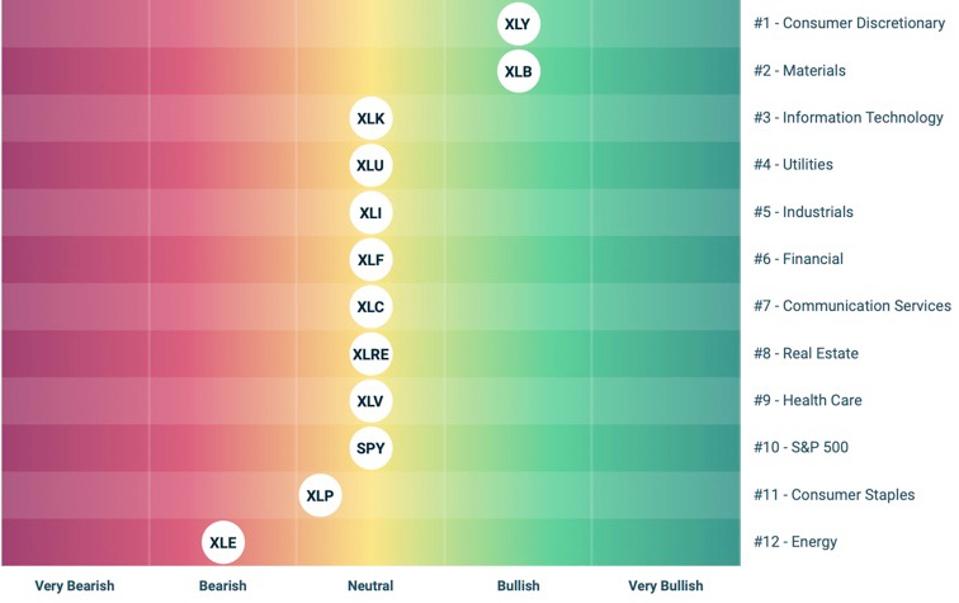
Images from PortfolioWise - Powered by S&P Global Market Intelligence/ClariFi
Notice the current leaders: consumer discretionary and material, both sectors are being distinctly cyclical. Figure 6 shows the top-ranked Sub-sector ETFs.
Figure 6
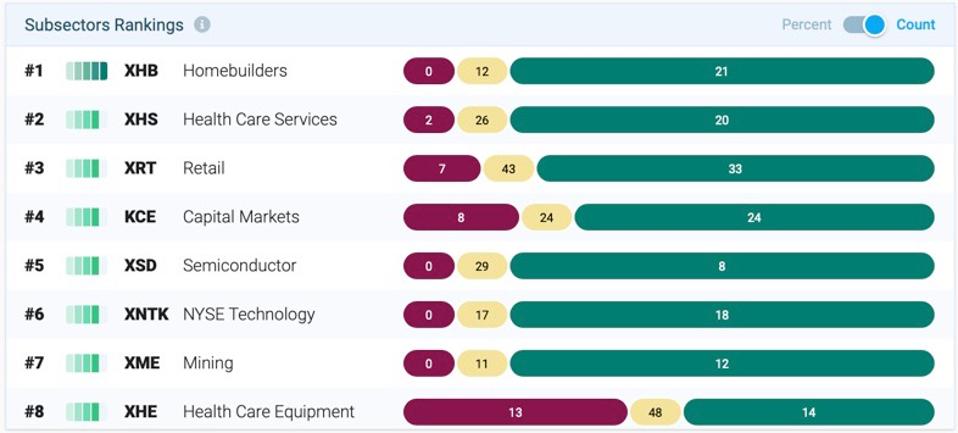
Images from PortfolioWise - Powered by S&P Global Market Intelligence/ClariFi
There’s a bit of variety near the top, but half of this elite group consists of clearly cyclical sub-sectors, such as homebuilding, retail, semiconductors, and mining.
Speaking of semiconductors, this is an area that holds many memories for me since, when I started in this business, this was high-tech. As an indication of time gone past, consider that semiconductors now are what steel used to be — a bellwether of the mundane economy. Looking at a 20-year view of a semiconductor ETF with a longer history than the one listed in Figure 6, we see that the semiconductors sector is not perfect as a proxy for GDP.
Figure 7
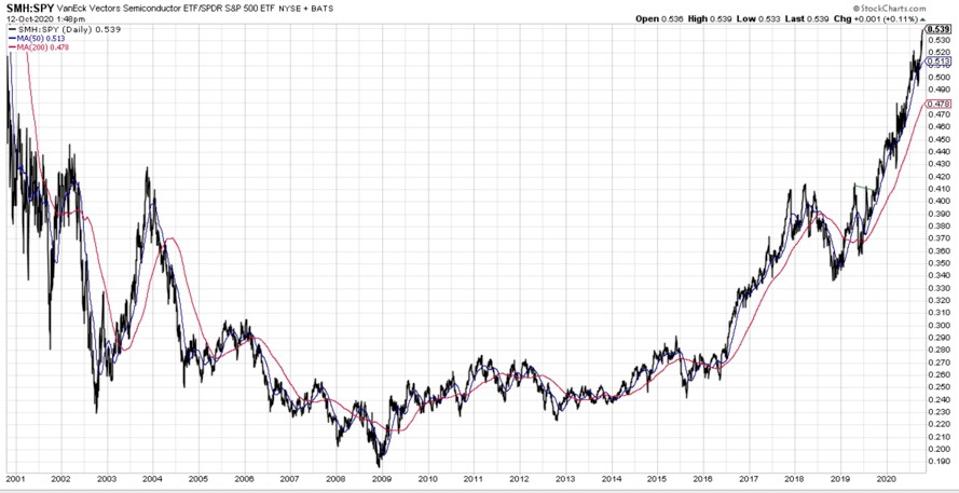
STOCKCHARTS.COM
It’s close enough to be meaningful. In other words, its imperfection as a proxy may owe more to the details of exactly how economists define GDP rather than the information about business activity we’re getting from semiconductor trends. And for our immediate task, we’re interested in business activity as it would likely impact higher-business-risk companies. So we can regard semiconductors as a useful indicator.
Here’s the one-year semiconductor view.
Figure 8
STOCKCHARTS.COM
The pattern is consistent with the positive view of the economy we’d need to support an investment case for small-caps. I wouldn’t go with the chart alone, as trends can reverse. But adding in the information we’re getting from our models makes me more comfortable. In sum, I think small-cap is likely to remain a viable focus, as long as our ranks continue to line up as they do.
Choosing Small-cap ETFs — Generic, Less-Generic, and Non-Generic
Obviously, the default choice is the iShares Russell 2000 ETF (IWM). If you want to cultivate an image as an iconoclast, there are some other generics you can choose instead of IWM, such as the Vanguard Small-cap ETF (VB) or the Schwab U.S. Small-Cap ETF (SCHA). If you want to go a bit further out on the size-based risk limb, you might try the iShares Micro-cap ETF (IWC). All of these have Bullish Power Ranks.
Interestingly, I expected to also mention the SPDR S&P 600 Small-cap ETF (SLY), but its rank is only Neutral; if you’re going to go generic, given that there are Bullishly ranked choices, I see no point in going down to neutral (Note that everybody defines cap-size ranges differently; SLY is actually 43.6% invested in stocks we deem mid-cap).
And then, there are the less generic or non generic offerings. The less-generic ones are those that have growth or value tilts (the growth versions are the ones more likely to be decently ranked nowadays). But the algorithms they use to classify style tend to be very ho-hum, the minimum needed to put a growth or value label on the product.
And then there are the non-generics, the more specialized, interesting offerings. These are the ones that have some valuable intellectual property underpinning them. They’re not active, but their “passive” rules are based on a lot of thought on the part of people who really know what makes some investments preferable to others.
Here are two non-generic small-cap ETF ideas, both of which are ranked Very Bullish. Both fall within the Small-cap Blend category Group, and are the two highest ranked ETFs within Small-cap Blend.
Figure 9

Figure 10
The foregoing images are from PortfolioWise - Powered by S&P Global Market Intelligence/ClariFi
Invesco Small-cap Value With Momentum (XSVM)
XSVM is an example of the proper way to invest for value. I know value has been as popular as dirty dishwater in recent years. But that’s not a problem with value; it’s a problem with the manner in which value has been widely applied; i.e., by (i) chasing low ratios without regard for whether the considerations that make a price attractive or unattractive — expectation for future growth and business risk — justify the low ratios, and (ii) fleeing high ratios, again, without considering whether the ratios are reasonable in light of growth and risk prospects.
We can’t plug in future growth — it hasn’t happened yet. We therefore need to work with proxy factors consistent with favorable future-growth expectations. Momentum is one important category. So this ETF, which combines Value and Momentum in a serious way, is an example of value-done-right.
Pacer US Small-cap Cash Cows 100 (CALF)
We know if we’re going small-cap, we’re choosing to take on more risk than we otherwise would. So why not do what we can to counter that to the extent feasible? And when it comes to risk mitigation, it’s hard to imagine anything better than cash.
By looking at any equity ETF, you’ve already decided you’re not going to go full cash with its essentially zero expected return. When buying shares of businesses, we could look for companies with tons of cash on the balance sheet. In my experience, however, I’ve seen the market turn cold shoulders to businesses that sit on the sidelines and pile up cash. Investors want operating companies to operate.
So instead of looking for a cash-heavy balance sheet, let’s instead look for cash-rich cash-flow statements. That’s what CALF is about. The 100 constituents in the ETF are selected from among those in the S&P SmallCap 600 index that rank well for free-cash-flow (FCF) yield, which is FCF divided by Enterprise Value, and weighted based on dollars of FCF capped at 2%.
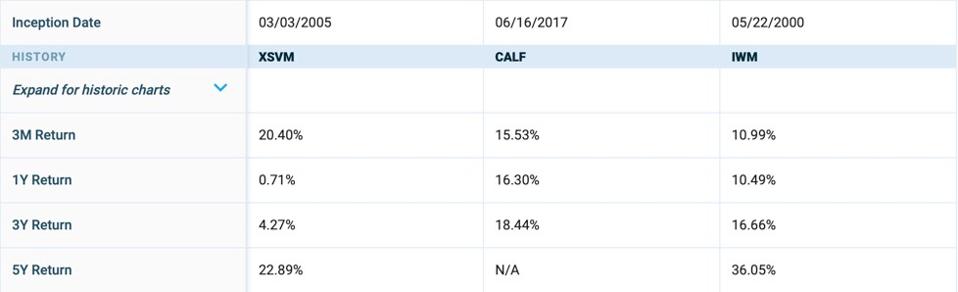
How To Use XSVM and CALF
These ETFs have different approaches and different kinds of sector exposure, so it’s perfectly reasonable to own both. Figure 11 shows how the holdings compare to one another and the giant-generic IWM.
Figure 11
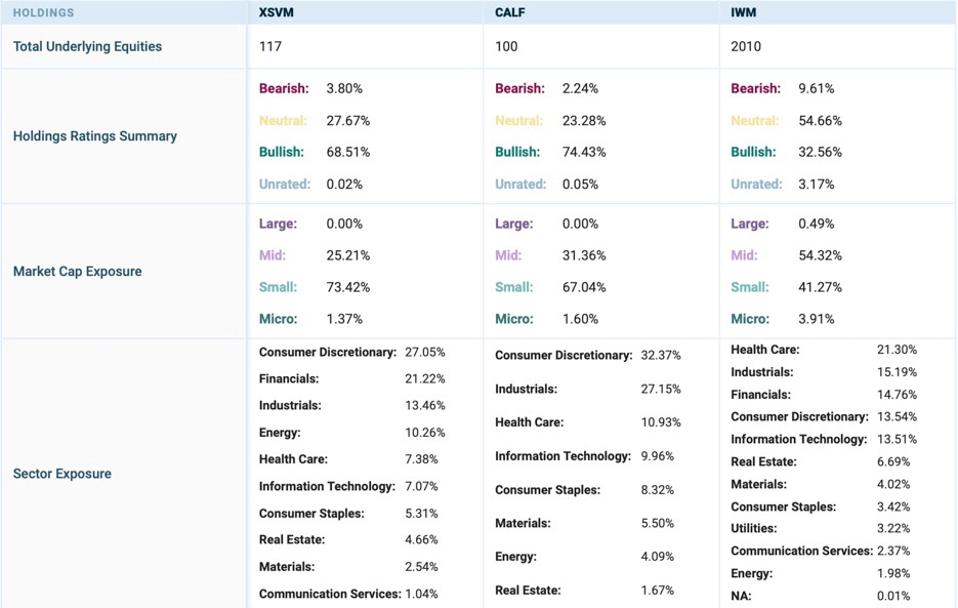
Images from PortfolioWise - Powered by S&P Global Market Intelligence/ClariFi
Those who like to really challenge the averages can consider just owning XSVM and CALF in order to establish small-cap exposure. Those who don’t want to go too far out on the limb, but would like to try for something better than IWM or IWM-like generic exposure can consider the core-satellite approach, with the lion’s share of the small-cap stake, the core, in IWM or an equivalent) and smaller stakes in each of these two satellite ETFs.
Either way, keep watching indicators of probable future economic activity. If a small-cap strategy fizzles, that’s where you’re likely to find the source of disappointment.
Disclosure: I am/we are Long XSVM, CALF.
Disclaimer: None.


