

Image source: Pixabay
Since Oct. 13, 2022, the S&P 500 index is up 11.80% on a price only basis. For the start of 2023, the S&P 500 index is up 4.16% through Jan. 13, 2023. The positive move in the market is welcome news to investors after last year's market experience, yet the S&P 500 index remains down over 16% from its peak in January of last year.
Nonetheless, this recent recovery in the market is triggering some bullish technical indicators. There is a large contingent of equity traders and analysts who view the technicals of the market as one of the most informative factors to consider when evaluating the potential direction of the market. This post will highlight a few of these technical measures, as some are providing favorable indications for a further move higher in the market.
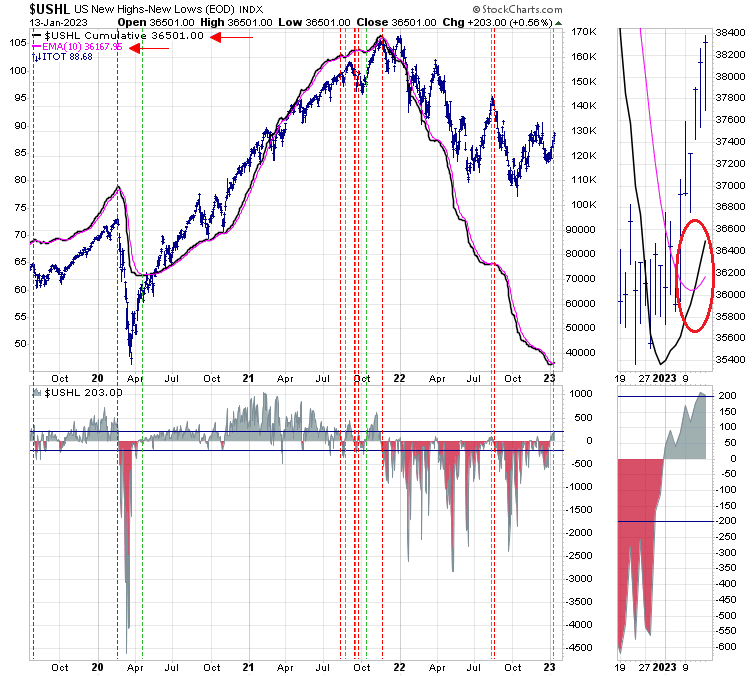
Below is a chart showing that the new highs minus new lows indicator (USHL) has crossed its 10-day exponential moving average from below on Jan. 11, 2023, i.e., the black line crossing the pink line. The vertical green lines on the chart highlight previous crosses of this nature.
In the past when this has occurred, the equity market (blue line) has moved higher, as represented by the iShares Core S&P US Stock Market ETF (ITOT). The red vertical lines indicate times the USHL crossed its pink 10-EMA line from above, potentially signaling a weaker returning equity market environment.
Importantly, follow through by the equity market needs to occur. In August of last year, a similar bullish cross occurred, but it lasted only a week.
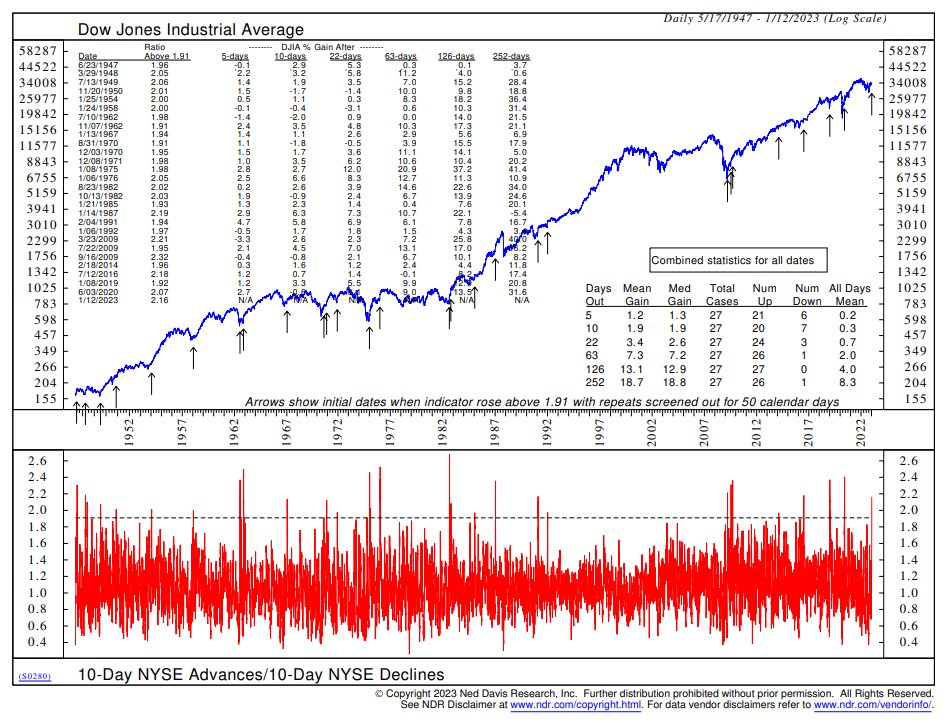
Ned Davis Research published a table and chart that utilizes a similar variable as seen in the chart above, but they evaluate the 10-day NYSE advances and declines ratio. When this ratio rises above 1.9, the Dow Jones Industrial Average tends to mostly generate positive returns, as shown by the chart below which looks ahead by 126 and 252 days.
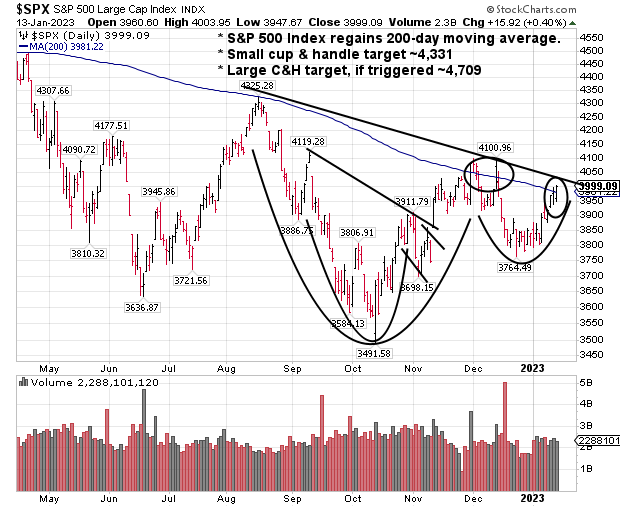
Technical analysts also utilize chart patterns to inform them on the potential direction of the market. One chart pattern is the cup-and-handle pattern (C&H), which generally plays out over somewhat longer time frames. The chart below of the S&P 500 index shows that two cup-and-handle chart patterns have developed, the larger one starting in August of last year and the smaller one sprouting in September.
The smaller C&H setup has been triggered with an S&P 500 index target price of 4,331. The larger one has broken out of its handle formation, but it faces resistance at the line formed at the top of the cup. The S&P target price for the larger C&H pattern would be 4,709 if a breakout occurs.
There are slight variations in calculating the target price, but one method calculates the price by determining the difference between the market price at the top of the cup to the bottom of the cup, and then adding it to the price at the top of the cup.
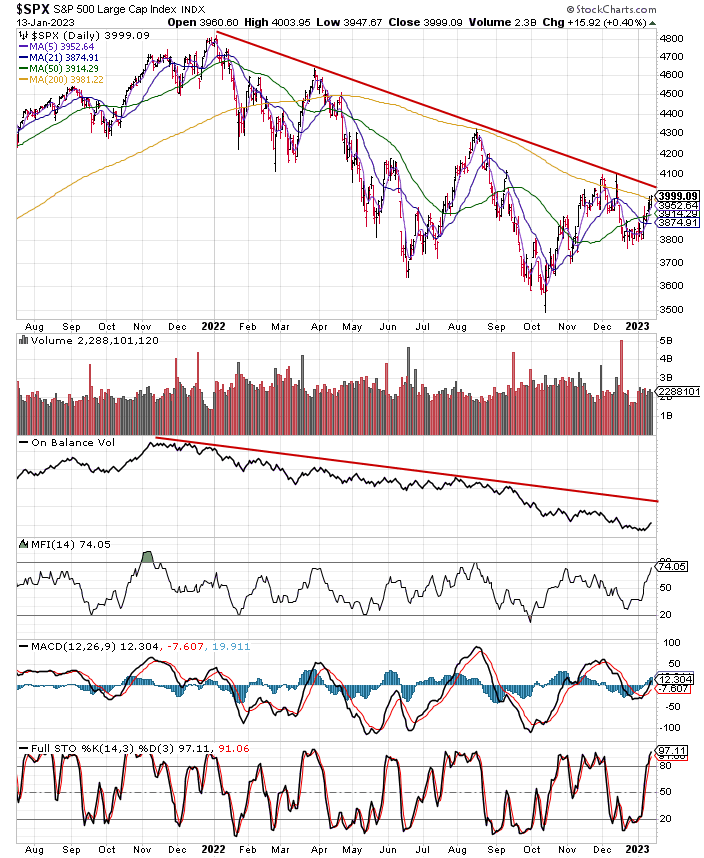
With technical analysis, there is no one particular chart that provides perfect insight into the market's future direction -- just as in using fundamental analysis, there is not one magic variable. As the technical factors mentioned above provide a favorable view of the market, the chart below shows a technical pattern noting near-term market headwinds.
The chart shows a longer-term view of the S&P 500 index, and the red line depicts resistance that starts with the market top in January last year. The S&P 500 index closed at 3,999 on Friday, and the market faces resistance at about 4,034.
Further, the yellow line on the chart depicts the market's 200-day moving average. This line is in a declining trend, and an indication of the longer-term direction of the market remains in a downtrend. An upward trend developing would be nice to see.
As we noted in our recently publish Winter Investor Letter, maybe the negativity around the market/economy is overdone, and perhaps a favorable equity market might be in store for investors in 2023? The equity market's favorable return since October is certainly resulting in some of the market technicals trending in a more favorable direction. That's at least one positive for potentially favorable market returns ahead.
More By This Author:
The Dow Stock Dogs Performed In 2022Equity Put/Call Ratio Above 2.0!
An Economy That Is Quickly Slowing

Comments
Log in or sign up to join the conversation.