
The short-term downtrend continues. Thursday and Friday were really rough days for stocks. This PMO index is pointing decisively lower and I won't be tempted to buy stocks until this indicator reaches all the way to the bottom of its range where the downside risk diminishes. It is time to re-commit to my trading discipline and the need to respect the risks associated with owning stocks.

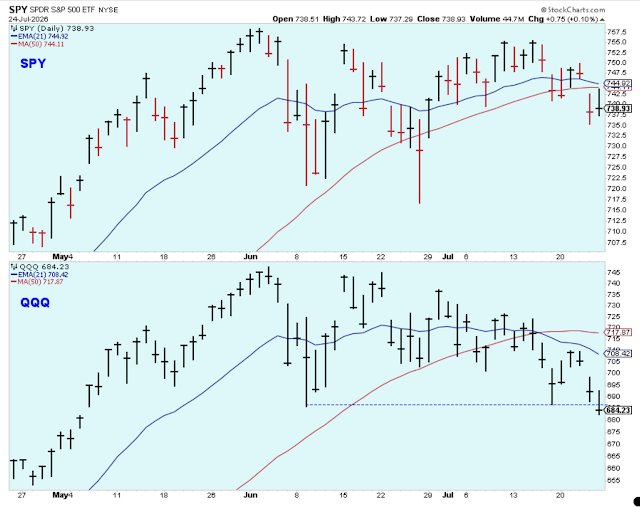
All the major indexes are pointing lower. Although, on Tuesday and Wednesday the major indexes did their best to confuse us with rallies. Even though the indexes closed at their highs on those days and hinted at the potential for another run higher, they couldn't close above their 10-days as a sign of weakness.
I like to use the 5-day averages when I'm trying to determine if there is a new short-term trend when the PMO index is at the top of bottom of its range, but otherwise I use the 10-day, 20-day, and 50-day averages. I believe in this case the 10-day did a good job to suggest that the Tuesday and Wednesday rally wasn't going to follow through. Plus, the market seemed to be news-driven on Tuesday and Wednesday, and that is always a reason to be skeptical.

The bullish percents of the major exchanges are pointing lower. They have rolled over, but in a calm fashion. I'm not sure how else to describe it. There is no sharp selling panic here.

In contrast to the bullish percents shown above, these bullish percents of the SPX and NDX show sharper moves to the downside. Maybe it reflects the fact that the general market has been in a larger downtrend for quite a while, whereas the downtrend for these two indexes is more recent, and as a result there is more volatility. It doesn't matter, though. All four bullish percents are pointing lower and are telling us to expect lower prices short-term.

The inverted 10-day Put-Call is giving us a fresh sell signal. The shaded area in the lower panel is the PMO index overlay of the options momentum indicator, and it shows that the 10-day options indicator is now nicely in sync with the general market's short-term trend.

The small-caps formed bearish wedge patterns that chopped higher until they reached resistance at their 50-day averages. They are now beginning to break down and they seem likely to re-test the January lows.

Junk bonds fell off a cliff this year, but found a bit of support this past week. This is definitely a bear trend, with the 50-day under the 200-day and both now pointing lower, but this a big move and there could be consolidation at this level. If the price of junk bonds holds near these levels, we will probably start to see stocks firm up, too. I'm watching this chart daily.

This is the same junk bond ETF but with a weekly four-year chart. It certainly looks like it topped out late-2021 with a bearish topping pattern of a lower low, then a higher high, and then a jump off the edge.

Back to the small-caps. I'm focusing on the small-caps because they tried to break out of a very bullish consolidation last fall. They then failed and broke down below support and into a downtrend that could take them much lower. When I have held short positions, I have been using bear-3x funds of the small-caps because I don't see a lot of upside risk with the recent price under such heavy resistance.

There are way too many new 52-week lows. However, the people at DecisionPoint mentioned recently that the market may be forming a bottom based on the pattern of new 52-week lows.
DecisionPoint says that bottoms often form when the prices of the major indexes test new lows but the number of new 52-week lows is well below the peak formed at a prior, recent low. I agree, although for now, the number of new 52-week lows is still way too elevated and continues to confirm the larger downtrend.

The people at DecisionPoint have some good comments about a bottom forming, but I think we also need to look at the larger picture using a weekly chart. This chart may be suggesting something different.
The current period of Nov. 2021 through Feb. 2022 looks like the late-2018 period to me. During that 2018 period, there was one sharp decline, a rally, then another sharp decline. The current period hasn't had the second sharp decline yet, but it certainly could be setting up for one, considering that we haven't had a rate increase yet.

When the major indexes are below their 200-day averages and there is an elevated number new 52-week lows, there is a lot of potential for bad things to happen. It is better to be on the sidelines in cash rather than trying to make money being long stocks.

The chart below is a very long-term weekly depiction of the SPX with panels below of the inverted unemployment trend and an upside down yield curve. The chart is designed to show that the peaks in the SPX coincide with the lows of unemployment and the diminishing spread between short-term and longer-term Treasury yields.
Sometimes the SPX peak coincides perfectly, such as 2000, and sometimes there is a lag, such as 2007. However, for this cycle, if the SPX has really peaked, then it is occurring well before the Treasury spread closes.
Maybe it is because the Fed needs to raise rates aggressively and the market is anticipating this, or maybe it is because the SPX really hasn't peaked. A third possibility is that the SPX ran up too far, too fast, and it is now right-sizing. That's my guess.

Bottom line: I traded fairly well in January, but so far in February I've been messing up. Currently, I have no long positions and I am about 30% short via bear-3x funds. The rest is cash. Note to self: you have a good trading strategy, so stick to it. And respect the risk.
Starting next week, I'll be reviewing the ECRI indicator again along with the longer-term market outlook on a weekly basis. The ECRI has started posting about the possibility of a recession, and with the market behaving so poorly, it is time to add the longer-term outlook back into the analysis.
Outlook Summary
- The short-term trend is down for stock prices as of Feb. 11.
- The economy is in expansion as of Sept. 19, 2020.
- The medium-term trend is down for treasury bond prices as of Jan. 3 (prices down, yields up).


Comments
Log in or sign up to join the conversation.