The Recent Short-Term Downtrend Continues

Image Source: Pixabay
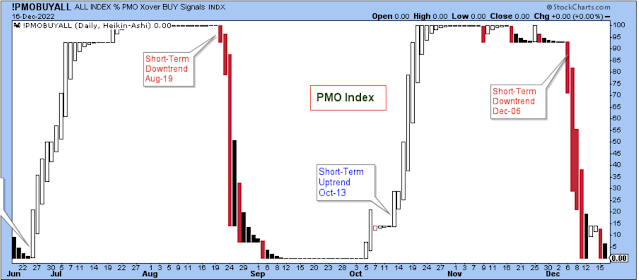
There was a bit of buying in the market on Tuesday and Wednesday, but then a flood of selling was seen on Thursday and Friday. So, the short-term downtrend that started on Dec. 6 seems set to continue.
The bullish percents are finally pointing decisively lower after ticking sideways for several weeks. I should note that these bullish percents never rallied to bullish levels, which I interpret bearishly for the general market. Adding to short-term concerns for stock prices is the fact that these two indexes have a ways to fall before reaching down to their prior lows.
This is an interesting chart. There has obviously been a lot of interest in higher yielding junk bonds, starting from early October. This past week, the ETF burst out above resistance in very bullish fashion, but then it quickly reversed and retreated in a bearish reversal. I consider a strong breakout that quickly fails to be a fairly bearish chart pattern, but then on Friday, the ETF found some price support.
So, I can't say that this ETF is pointed lower, although looking at the momentum indicator, it certainly appears ready to roll over. In other words, the larger downtrend is still intact, but a new short-term downtrend for the ETF hasn't begun just yet.
Despite the strong selling of stocks on Thursday and Friday, I can't get overly bearish towards stocks while the price of this ETF holds at current levels.
The chart above may be holding up well, but this chart below of the NDX is not. This index broke down on Thursday and has now clearly finished its short-term counter-trend that resumes the larger downtrend. This is bearish.
For years I've been telling myself that I needed to dig deep and fully understand the VIX instead of following it superficially. But it has never happened for me, and I doubt it ever will. It just isn't my favorite.
This index is a measure of market volatility and the market has seemed volatile to me, yet the chart doesn't reflect that volatility. So, is this chart bullish or bearish for stocks? I don't really know, so I'm sticking with the most-used (maybe overused) explanation that when the VIX is at the lows, you sell stocks until the VIX is at the highs, and then you buy stocks.
Here is a larger, three-year view of the market showing the transition from the peak in December 2021 into a long-term downtrend. In addition, it shows that there have been three major counter-trends that touched the downtrend line. Now, the market has just completed the third upward counter-trend and is pointed lower again.
Based on this chart, it seems almost certain that the price of the SPX will at least reach down to the June low and perhaps form a bullish inverted head-and-shoulder basing pattern. Another possibility is that the SPX will fall all the way down to the 3500-level and test the October low and form a bullish double bottom basing pattern. Or, a third outcome is that the SPX will break down below 3500, forming a very bearish continuation pattern.
As a market technician, you have to assume that a trend is in effect until proven otherwise, and therefore I am assuming a bearish outcome that puts the SPX at about 3200 before the next upward counter-trend begins. This is very bearish.
I am a market bear, and that includes small-caps. I believe that this chart continues to point towards lower prices.
The sad story of Musk-Twitter-Tesla continues, but I don't really think the story is what's driving Tesla lower. I think the reality of the market would have driven down the stock price regardless of Musk.
The first price target is 135, which is getting close. Once the stock price hits 135, I would expect at least some choppy sideways price action. Then we must watch to see if it holds or breaks down further. There isn't strong support under 135 until about 110, and ultimately, in a worst case scenario, the stock could target 65.
I will conclude today's post with a chart of the number of new 52-week lows, and the simple comment that there are a lot of new lows, emphasis on "a lot." The best signal that a new bull has started is when stocks stop falling to new 52-week lows. It is as simple as that.
Bottom Line
I have shown a lot of very bearish charts in this post, and one important chart of the JNK that is bearish longer-term but is still looking okay in the short-term. I will reconcile this by saying that I am positioned in my accounts bearishly but not anywhere near as bearish as at other times this past year.
I have one very large short-position and a number of smaller short positions that I modestly added to on Thursday and a bit again on Friday. Ordinarily, I would not add to shorts with the PMO index at its lows, but the breakdown in the SPX and NDX below support on Thursday was such a bearish signal that I decided to act on it.
Outlook Summary
- The short-term trend is down for stock prices as of Dec. 6.
- The economy is at risk of recession as of March 2022.
- The medium-term trend is higher for Treasury bond prices as of Nov. 19 (prices higher, yields lower).
More By This Author:
A Short-Term Downtrend Started On Weak VolumeStock Market Commentary: Headline Charts
The Best Time To Buy Stocks In The Short-Term Has Passed
Disclaimer: I am not a registered investment adviser. My comments reflect my view of the market, and what I am doing with my accounts. The analysis is not a recommendation to buy, sell, ...
more


