
The Juggernaut Continues
Once again it looked like American shares had met their match, but the latest selloff turned out to be one more brief correction before buyers stepped in and drove prices higher. By the end of Friday’s trading (July 23), US equities rose to yet another record high.
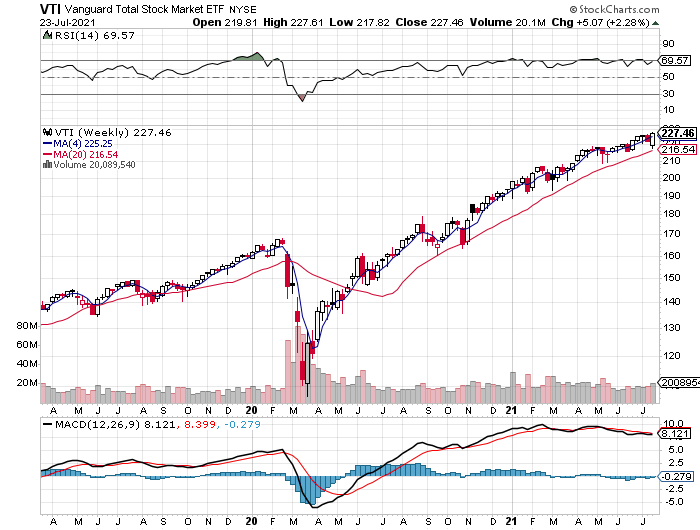
Vanguard Total US Stock Market (VTI) rose 2.3% this week. In addition to dispensing another sharp U-turn to the upside, US equities also posted the best performance for our 16-fund opportunity set.
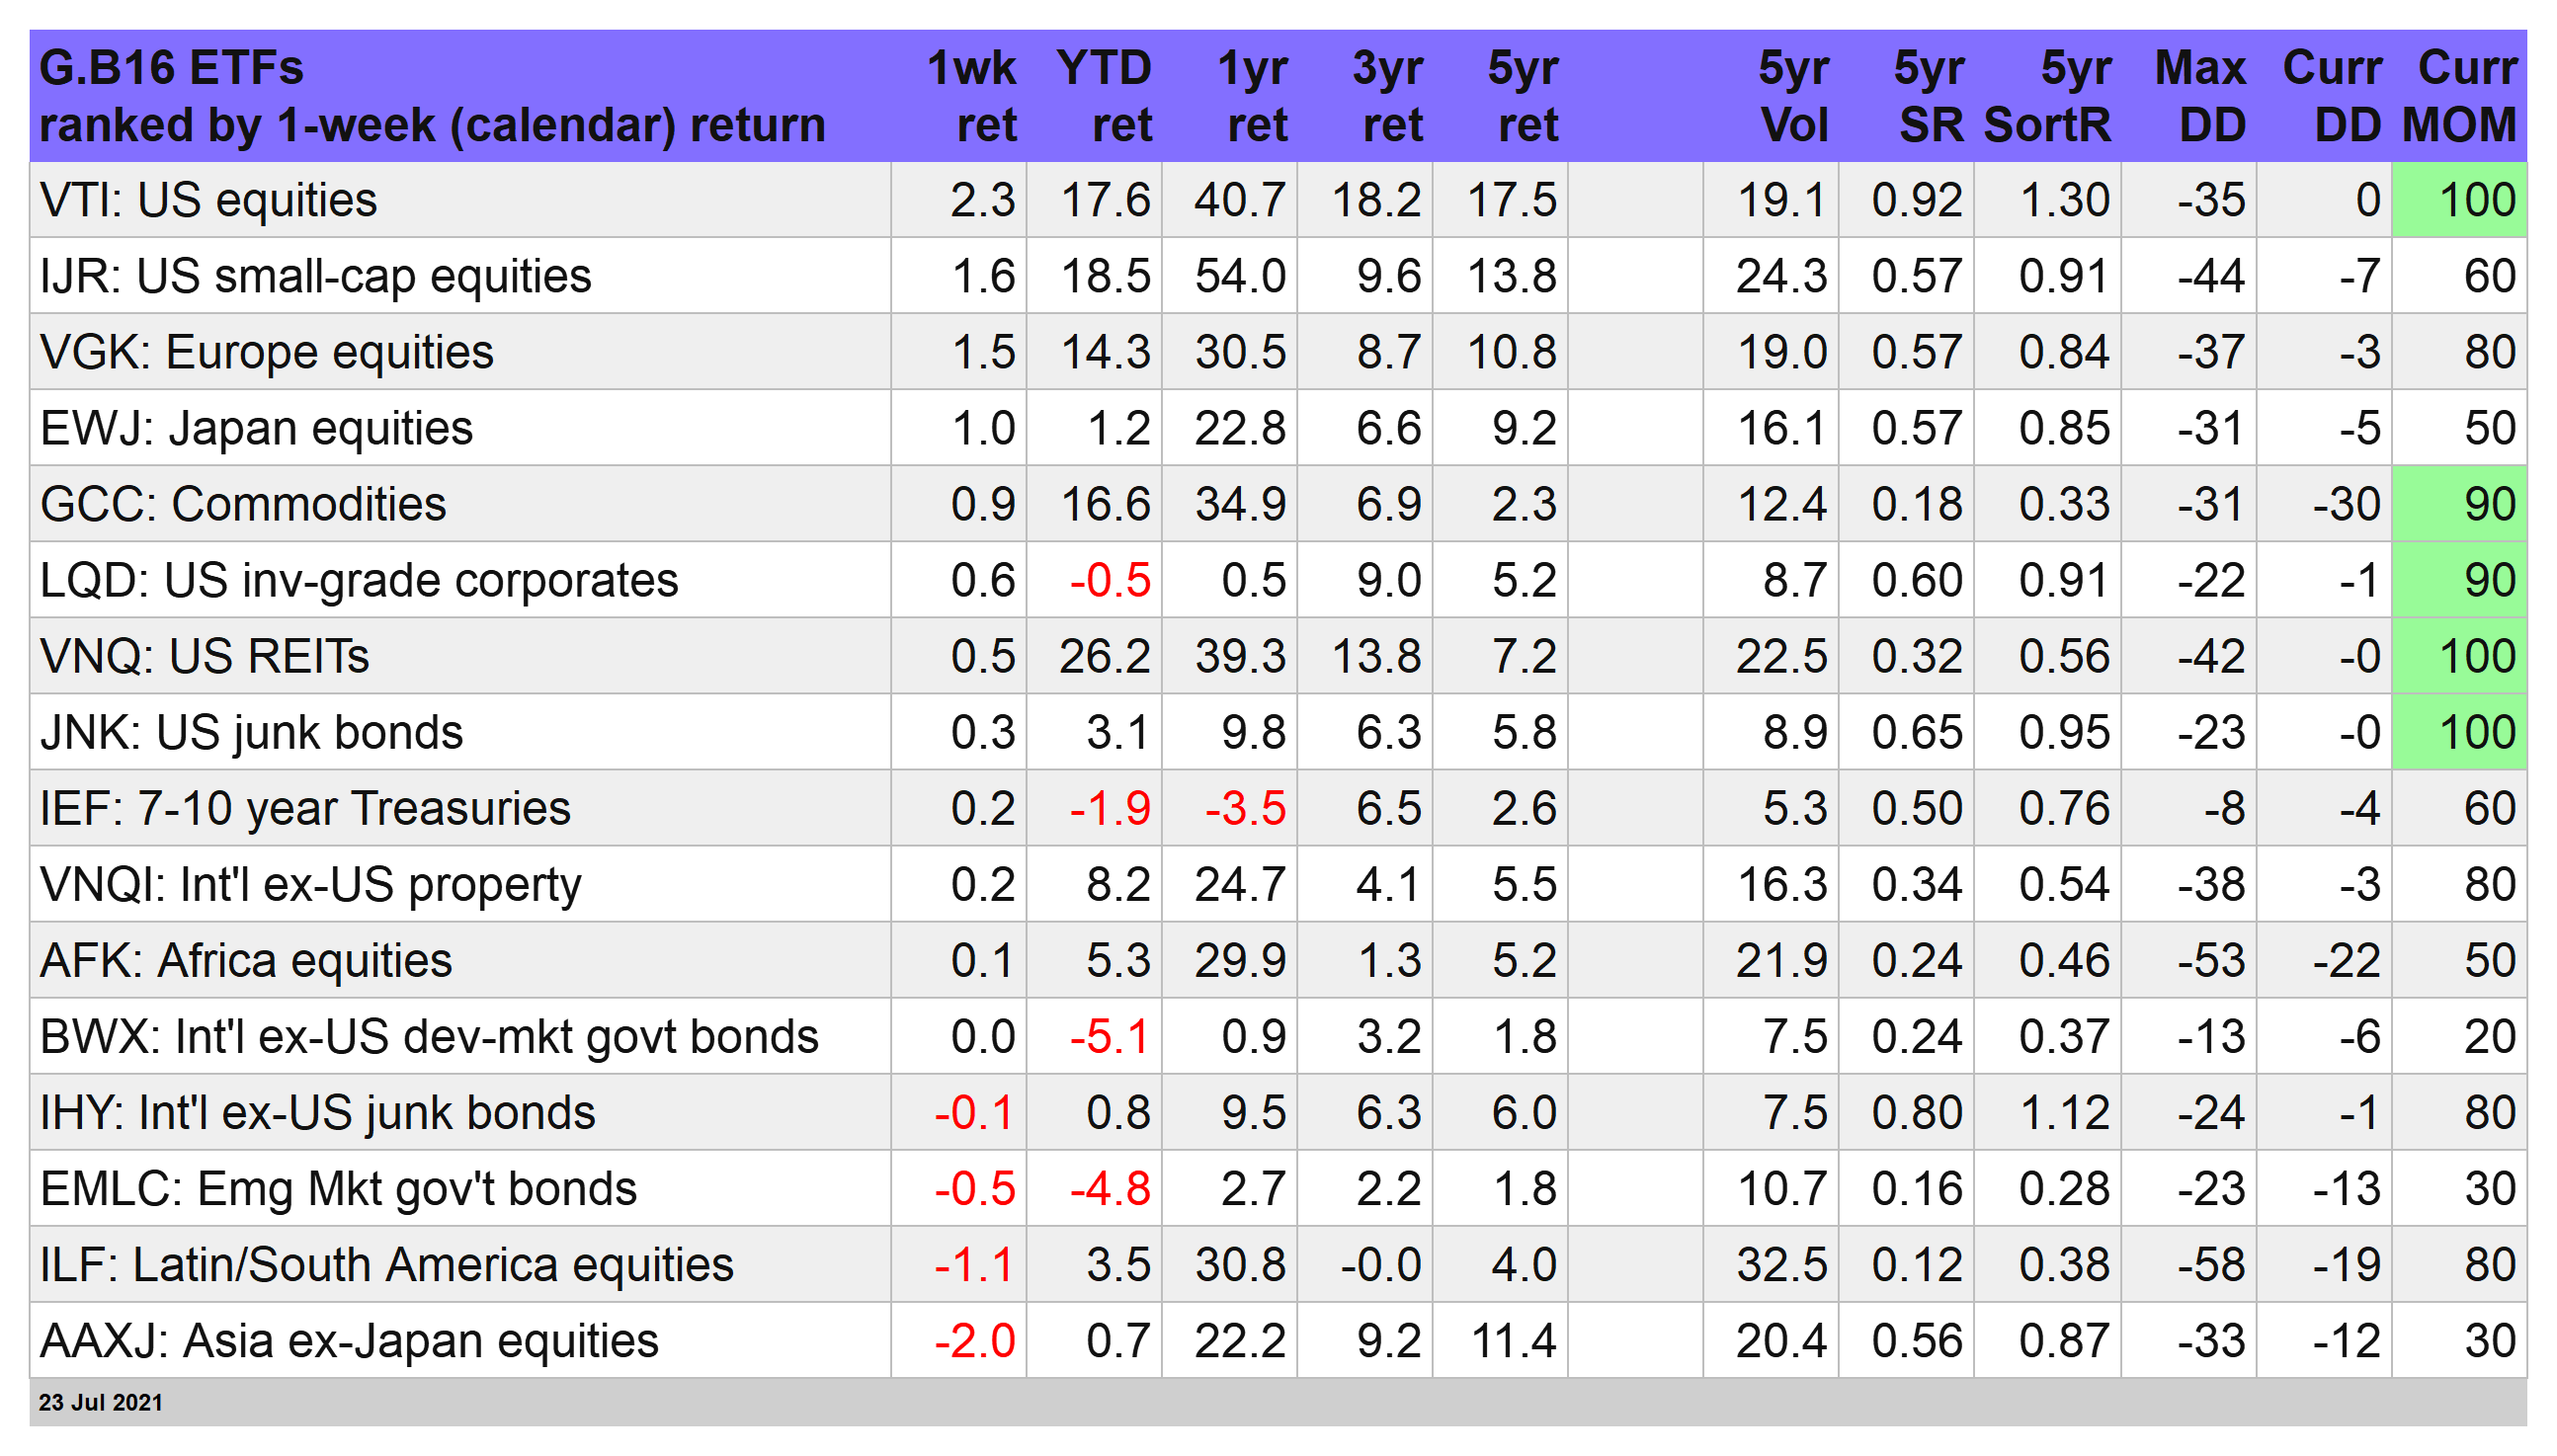
The relentless run higher in US shares confounds many investors, particularly of the value-oriented persuasion. But it’s hard to argue with success, or bullish momentum. On the latter score. VTI continues to exhibit an ample supply. That’s obvious in the weekly chart below and via the top-ranked 100 MOM score for VTI per the table above.
Although there were some losers this week, an upside bias prevailed for the most part. The main exception: stocks in Asia ex-Japan suffered a sharp setback. The iShares MSCI All Country Asia ex Japan (AAXJ) shed 2.0%, cutting the ETF to a two-month low.
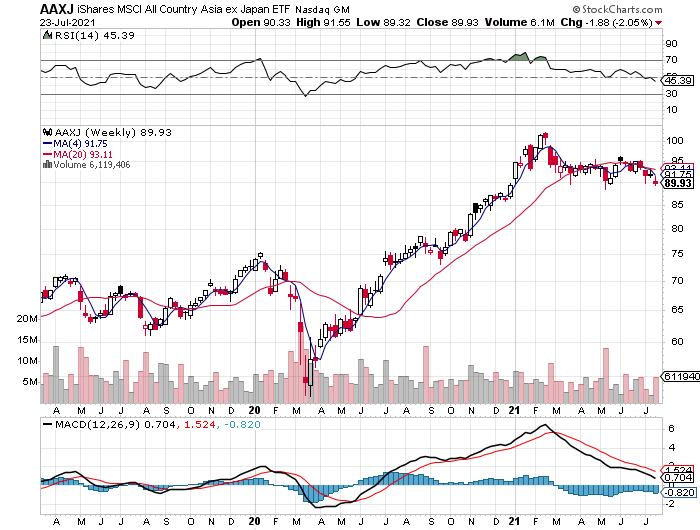
AAXJ’s momentum bias has become increasingly bearish recently, which is showing up in a MOM score of just 30. A key reason: ongoing weakness in China stocks, which comprise more than 40% of AAXJ’s portfolio. An increasingly harsh regulatory climate in China, combined with rising tensions between Beijing and Washington, are key factors.
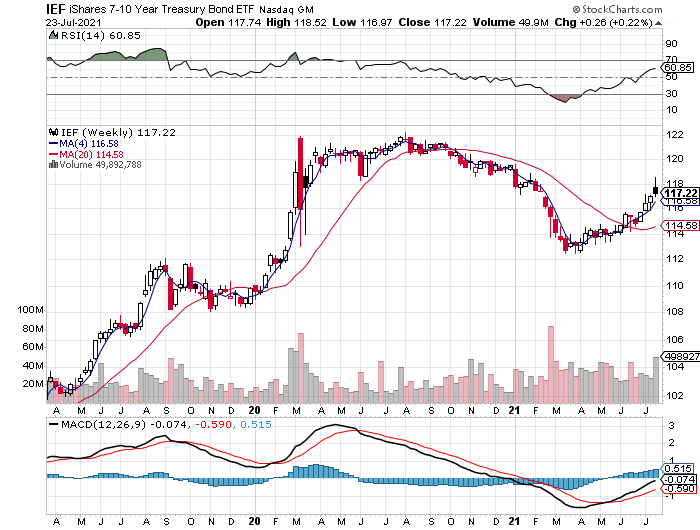
Meanwhile, the slide in the 10-year Treasury yield continues, although there are hints that the decline has run its course, at least for near-term. Earlier in the week, the 10-year rate fell below 1.20% for the first time since February, but then rebounded in subsequent trading sessions. For the week, however, the 10-year ticked lower again, and so it's premature to assume that the downside bias has ended.
The tailwind of lower rates continued to give the iShares 7-10 Year Treasury Bond ETF (IEF) a lift and the fund ended up for a fourth week.
Big Bounces for Strategy Benchmarks
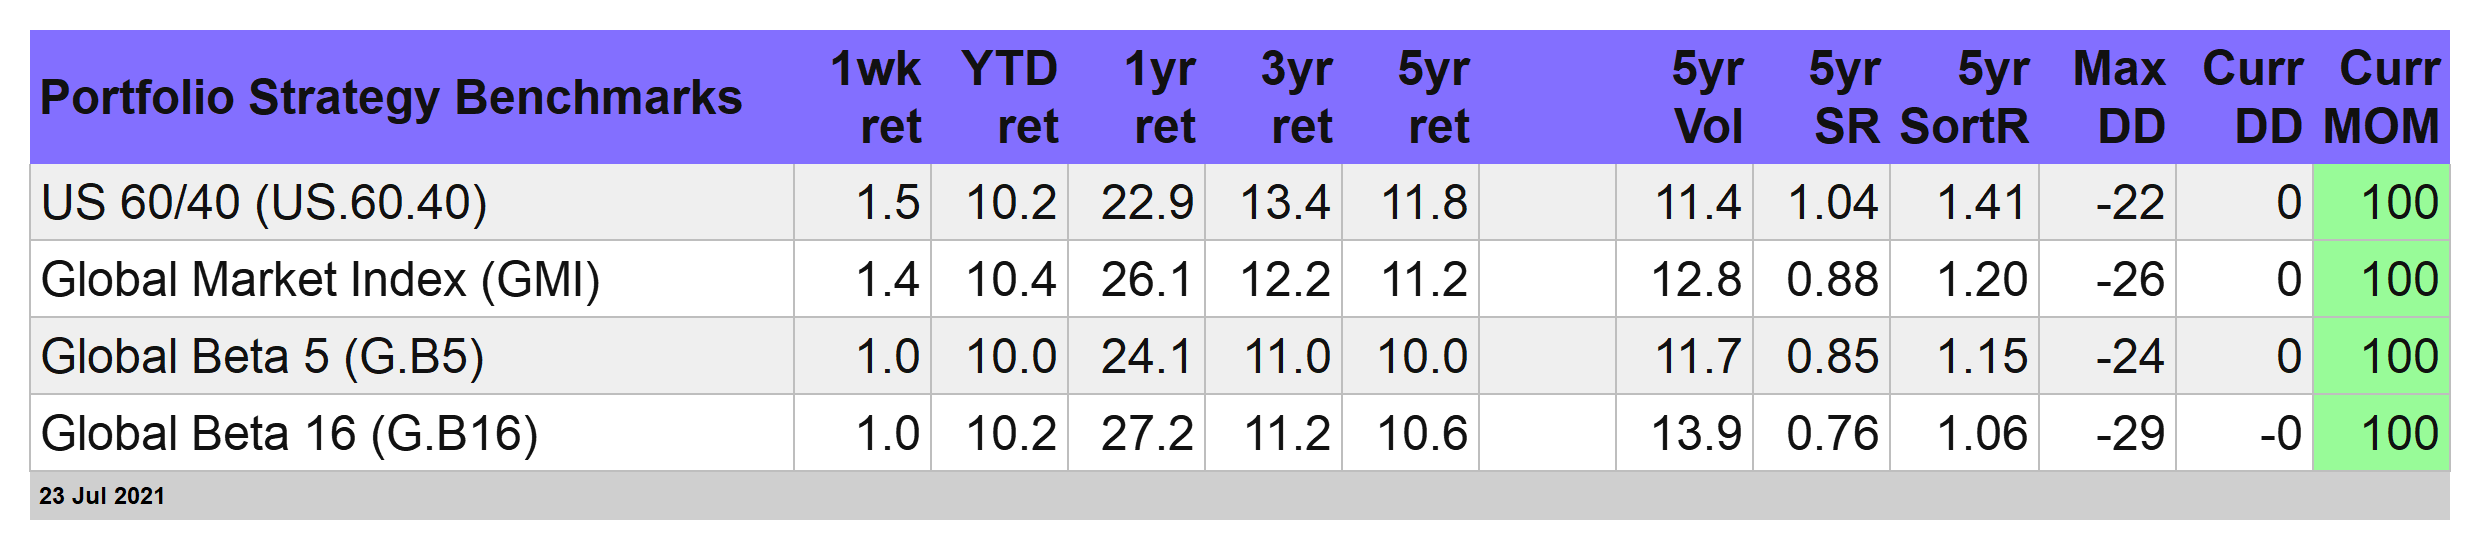
The correction in our strategy benchmarks in the previous week turned out to be short-lived, or so this week’s powerful recovery suggests. The US 60/40 stock/bond benchmark led the recovery with an impressive 1.5% gain for the trading week. The Global Market Index (GMI) is in close pursuit with a 1.4% rally.
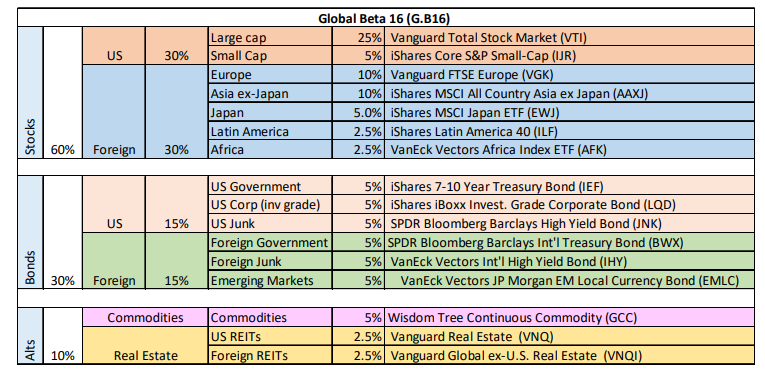
Our standard portfolio benchmark — Global 16 (G.B16), which owns all the funds in the table above — was a relatively weak performer with a 1.0% gain for the trading week, but that’s enough to keep this benchmark in the lead for the year via a sizzling 27.2% total return.
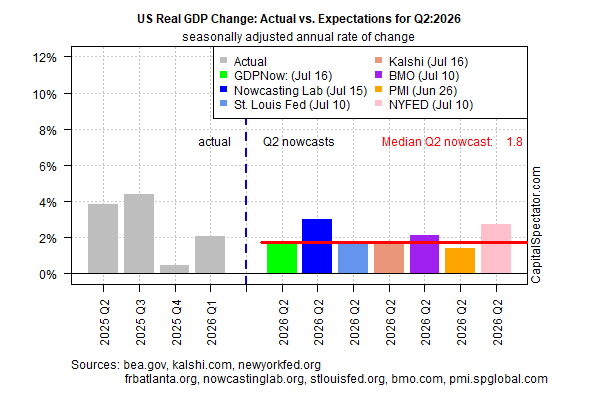
The main risk for markets is the Delta variant of the coronavirus. Investors are wondering how big a risk the next phase of COVID-19 presents for the global economy. For now, most markets are shrugging off the risk. Indeed, judging by the strong upside momentum in all four of portfolio strategy benchmarks this week, the trend remains decidedly bullish. Let’s see if the crowd has the confidence to extend that view in the week ahead.


Comments
Log in or sign up to join the conversation.