
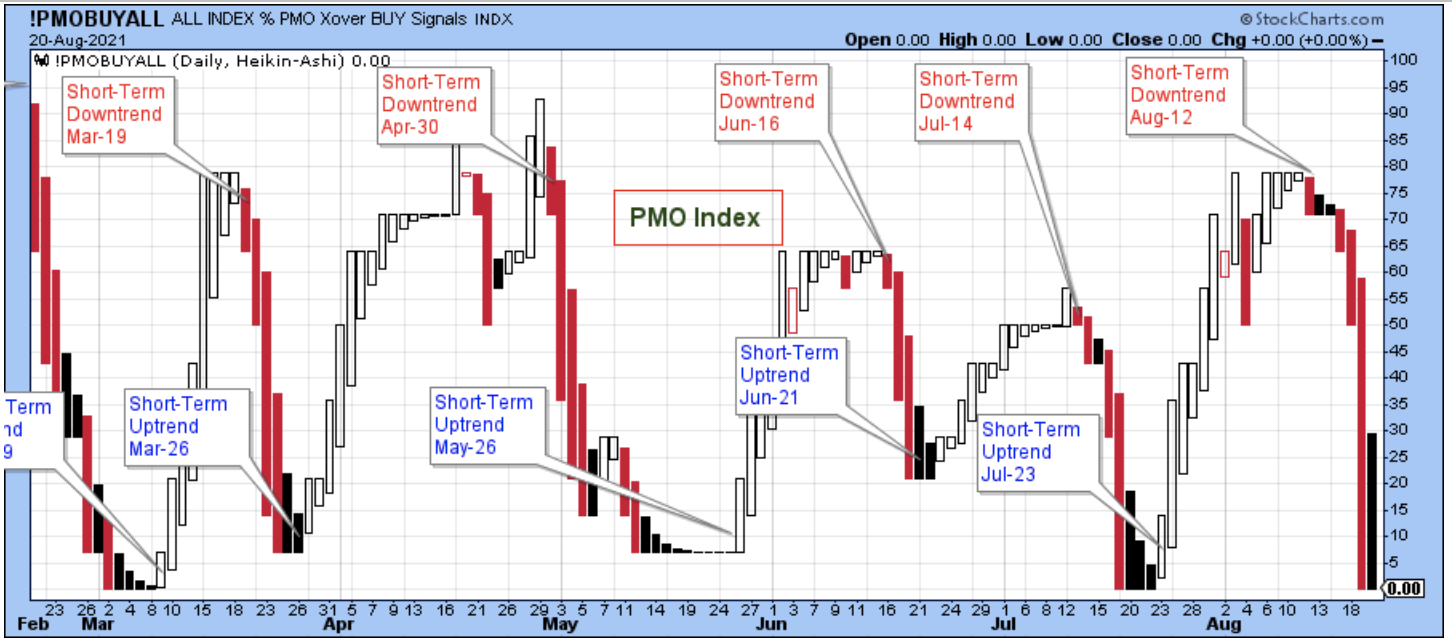
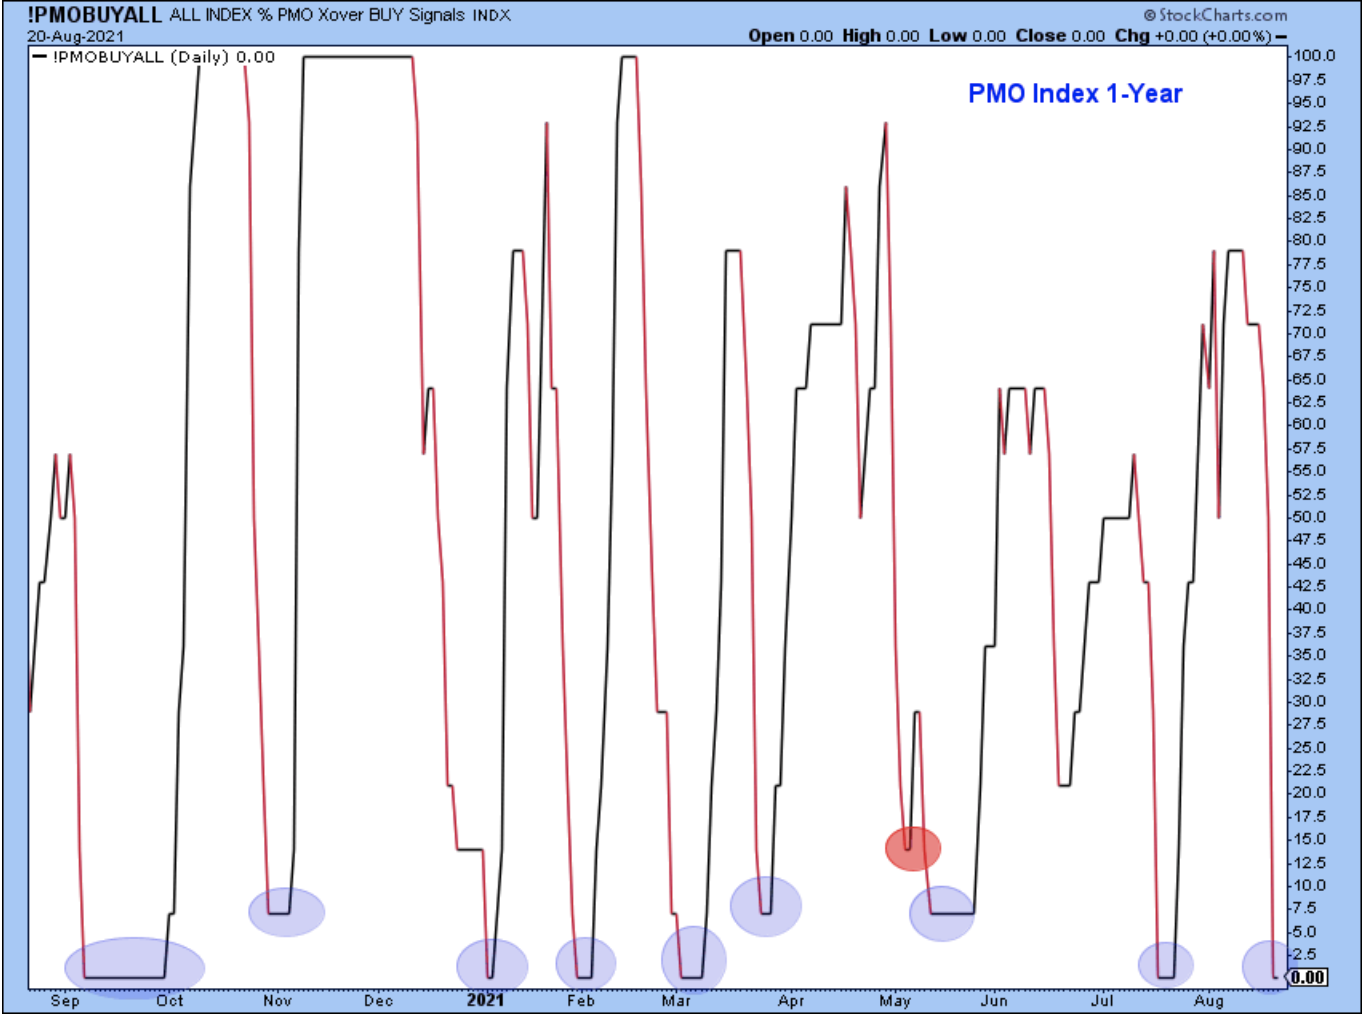
A short-term downtrend started on Tuesday, Aug. 12, as shown in the chart below of the PMO index. The serious selling started on Tuesday and it took only three days for the market to push the PMO index from the 70-level down to zero. That's a swift move lower and a reminder to me that I have to be decisive about taking profits because they can disappear so quickly.
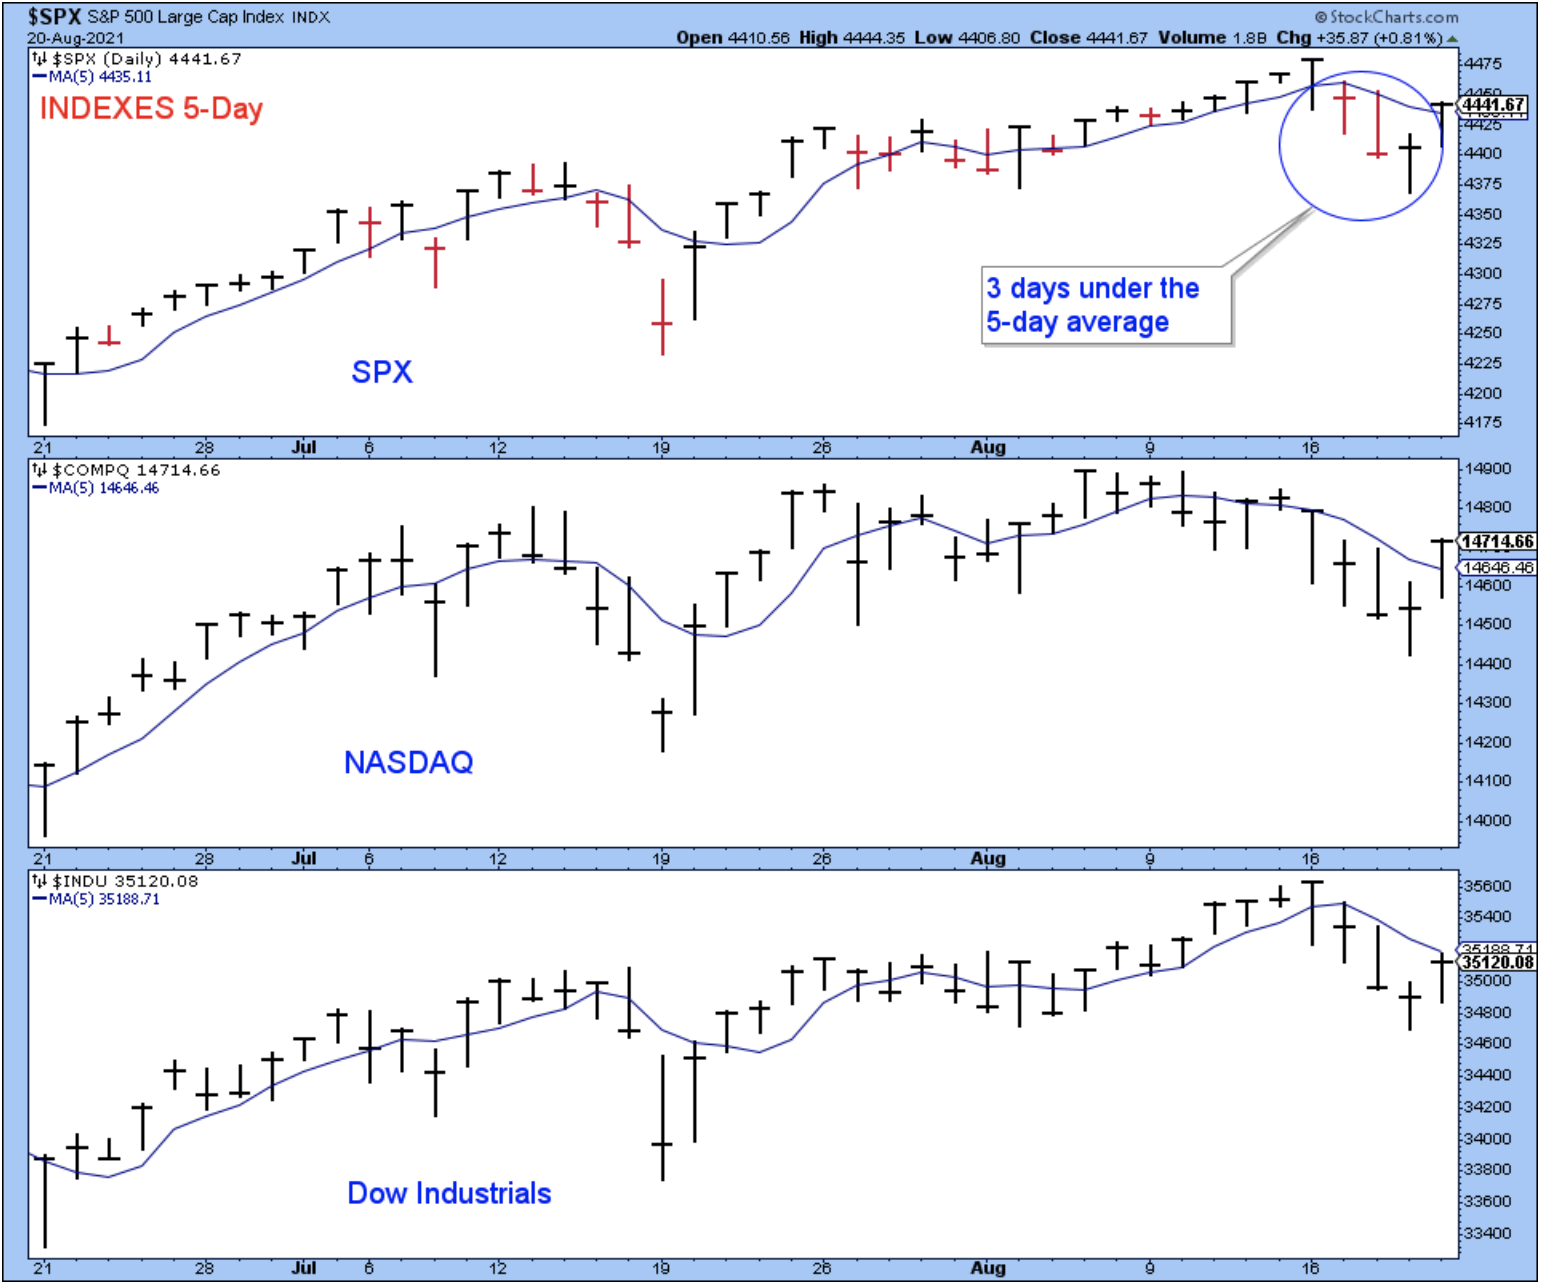
Is it possible that the PMO went from 70 to zero in only three days? And could the next short-term uptrend be starting already? The chart below shows that the SPX traded under its 5-day average from Tuesday to Thursday. The Nasdaq, on the other hand, started to trade under the 5-day several days before the SPX, and eventually its weakness spilled over to the SPX.
And now? Both indexes have bounced back above their 5-day averages with strong closes. It does look like the beginning of a rally, although we have to give it a few days in order to know for sure.
I don't like these brief, shallow declines because the next rally is likely to be weak, but I'm not going to fight the market and I'll just follow along with what it has to offer instead. However, such a brief downtrend is all the more reason to be mindful that the risk of a correction is high.
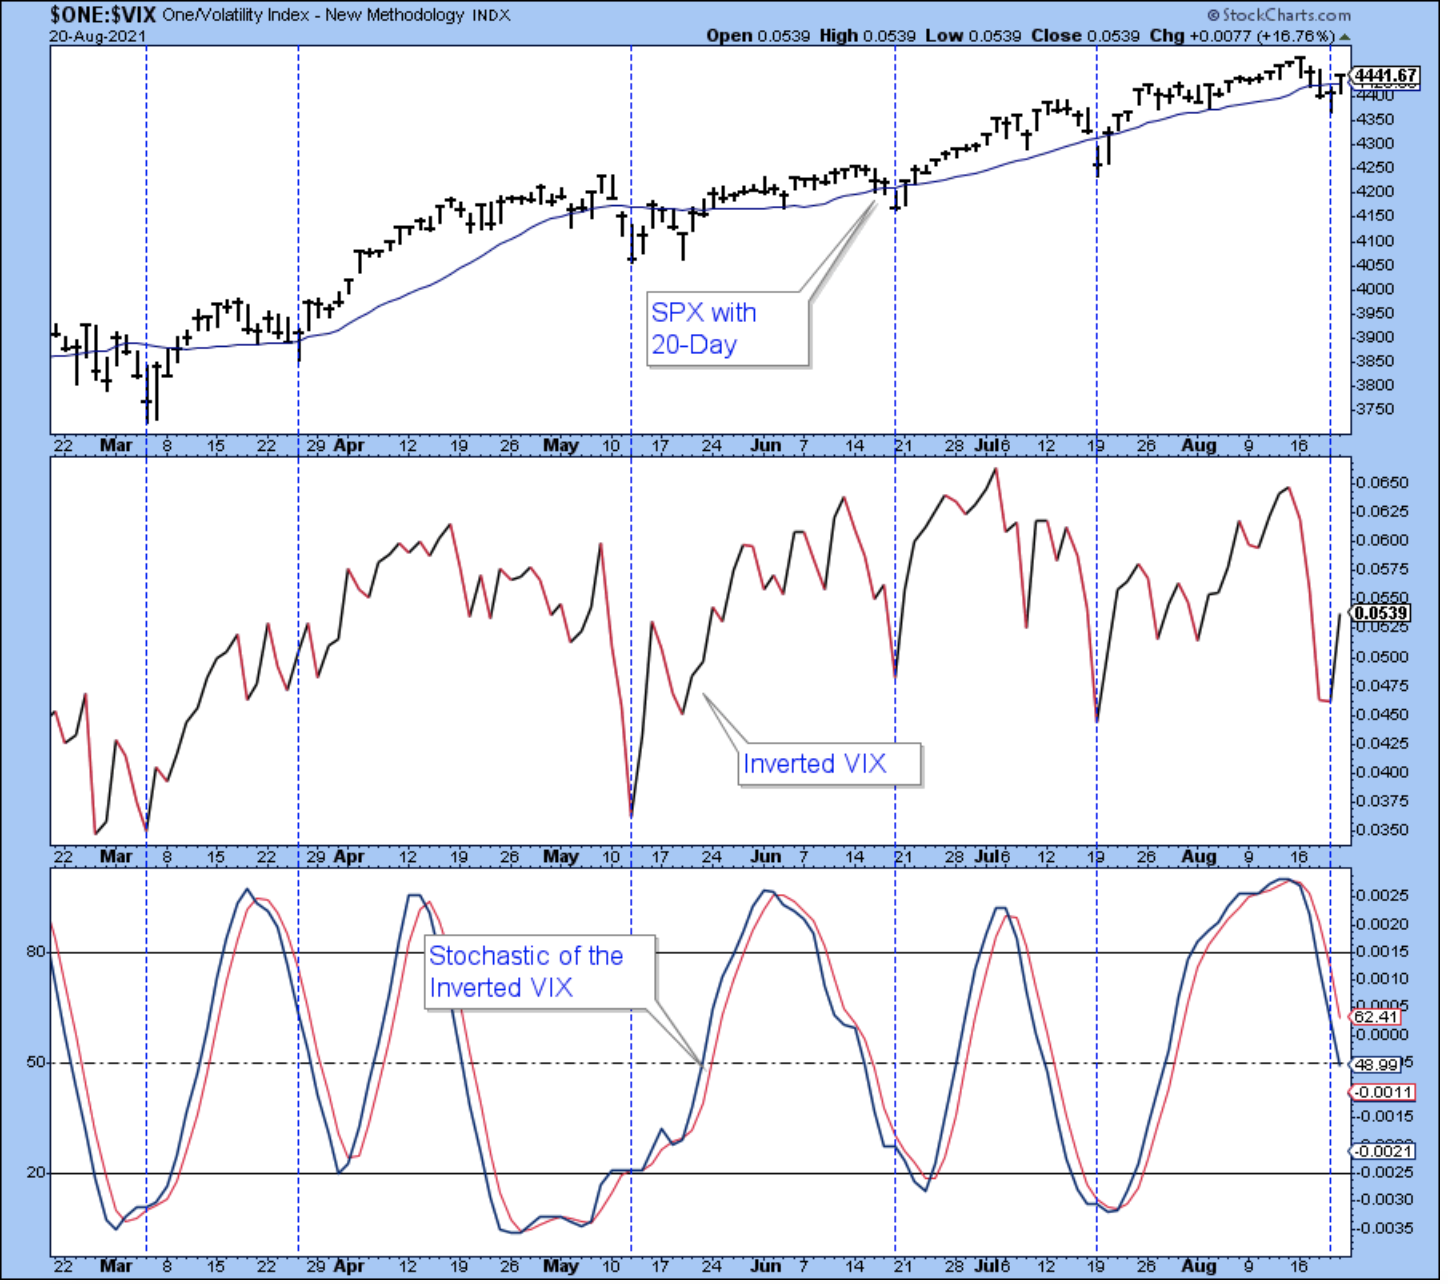
The chart below is a follow-up from last week in which I added a chart of the inverted VIX with a momentum indicator. I don't like that we are seeing the market rally before the stochastic has a chance to reach down to the bottom of its range. It makes me suspicious that we are being drawn back into stocks too soon.
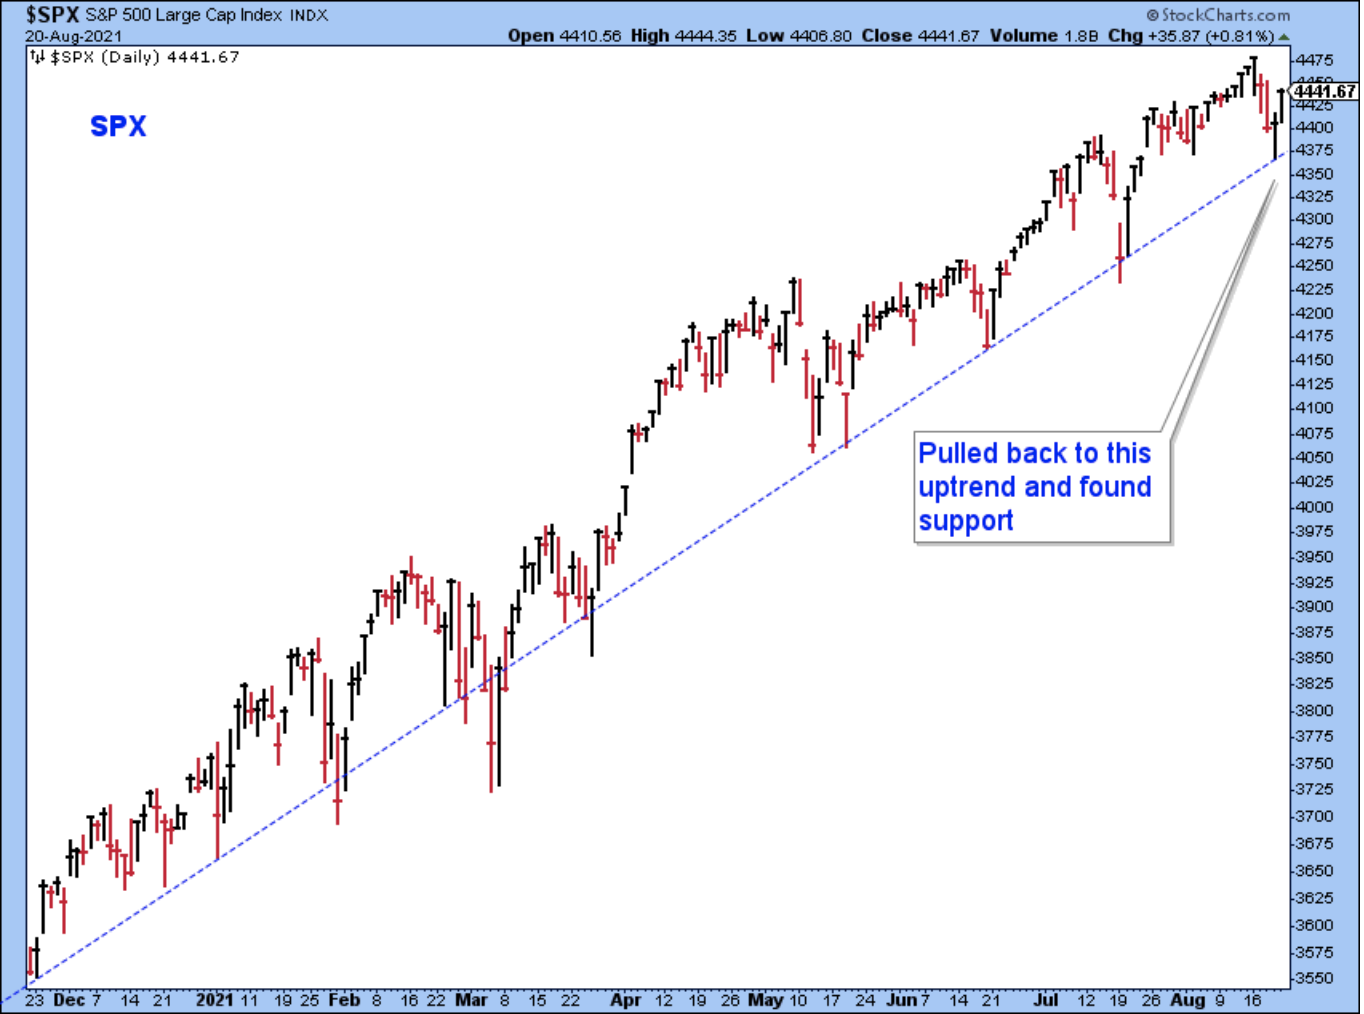
The SPX bounced off of uptrend support. This pullback and reversal higher looks so bullish, but bears like me will be watching for a break of this trend. For now, though, with a strong uptrend like this, being a bear puts you on the wrong side of the market.
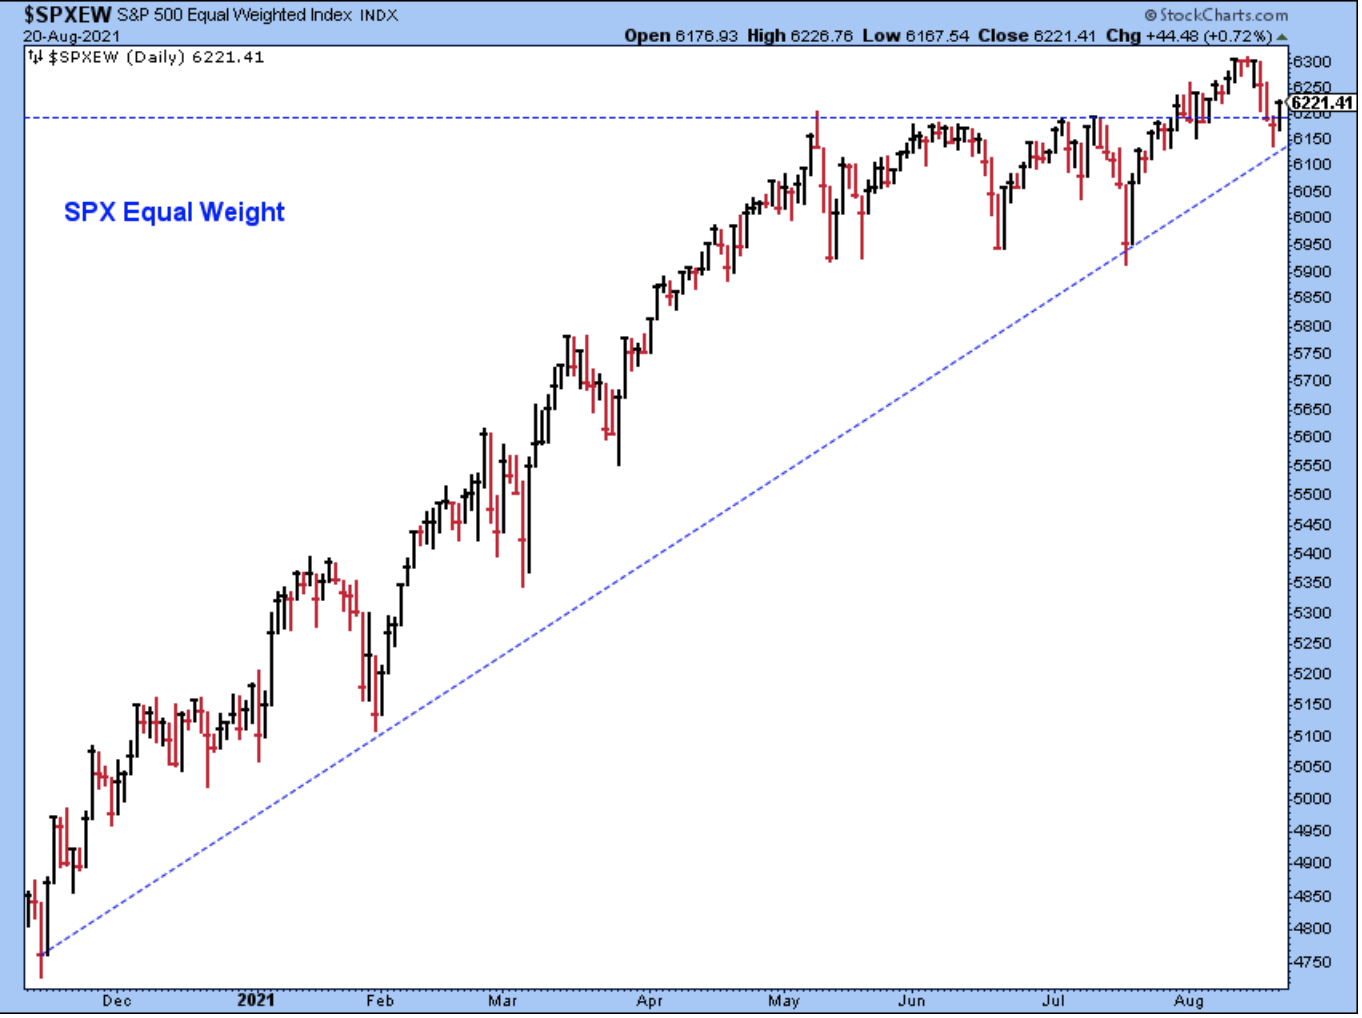
The SPX equal-weight also found support and if this were a stock, I'd be a buyer. I don't see the signs of a market rolling over in either the SPX or the SPX equal-weight.
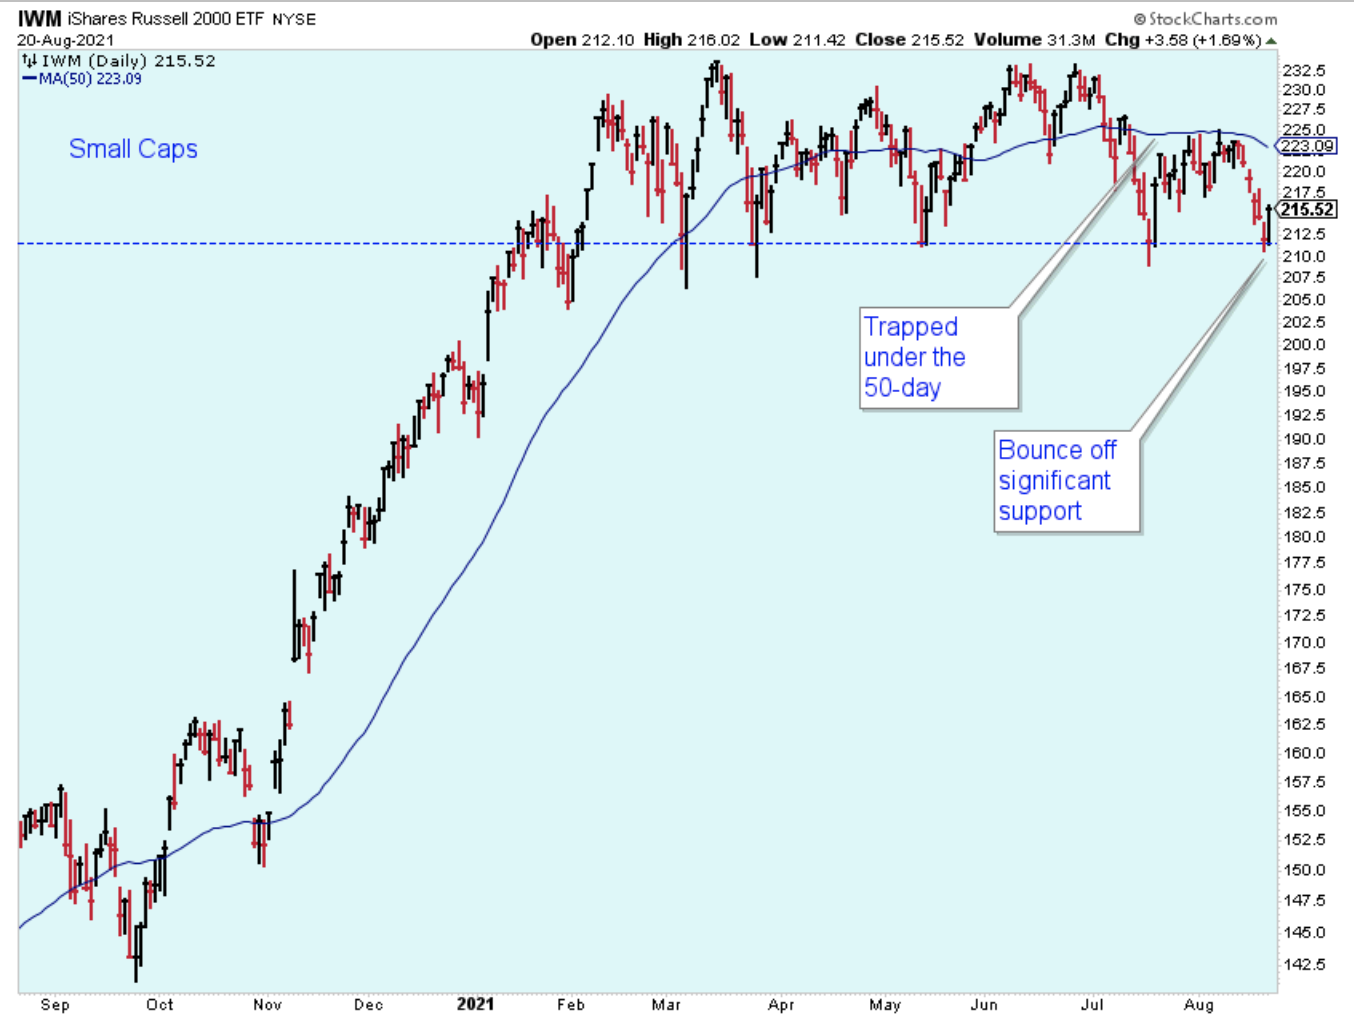
Another chart showing support. The small-caps found support, too, although this chart looks precarious. This index looks to me like it could break down. Obviously, it is the small-caps that are experiencing weakness and it is the large-caps that have the strength.
Bottom line: a short-term downtrend may have bottomed on Thursday, but we need a few days to confirm. Market breadth is weak among the small-cap stocks, but the large-cap indexes continue to perform really well. I am trading accordingly.
Here is another look at the PMO index using only a solid line instead of candles. This chart helps remind me that every year there are about nine short-term buying opportunities. The low in the PMO marked in red is to point out that there are also occasional bad or confusing signals.
Buying stocks when the PMO is at these lows and selling stocks when the PMO is at the highs has been a profitable approach for me. In fact, it is really the only way I have consistently made money in the stock market. But sometimes I forget, and I need this chart as a reminder so that I don't drift away from my own trading plan.
I consider this strategy of buying the PMO lows and selling the PMO highs to be a trend-following trading plan, but it can feel odd at times, particularly at the highs when I am selling into strength while also seeing stocks breaking out. And it is also a strange feeling when I'm buying at the PMO low when there are so many indications of market risk.
What to do in the current market? I bought some stock on Friday of companies that are showing relative strength, but I also have some small positions in bear 3x funds for the small-caps and emerging markets. In the coming week, I wouldn't be surprised if all these positions do well as the large-caps bounce back and the small-caps and emerging market struggle. But my guess is that at some point, they'll get back in sync and go up or down together.
This is a good time to point out that every year there are one or two corrections that exceed what can be considered short-term, so you have to be cautious and ready for them. You can't just wait for the short-term low and then pile in. When you buy at the lows you have to continue to monitor the health of the market and be ready to take some small losses, and move back to cash if necessary.
The correction in February was particularly difficult for my style of trading. Generally, I'm watching the entire market and assuming all stocks will move up and down together, but, as we all remember, in February the correction only took down high PE-growth stocks while the rest of the market rallied.
That isn't usually in the playbook, so I wasn't as on top of it as I would have liked. I recovered because I am no longer stubborn and instead of holding on to the declining stocks, I sold them and made up for the losses by jumping into the stocks that were going up in price. The point is: if you buy the short-term dip, then be prepared for the possibility that prices may go even lower. Don't hold on just to prove that you are right.
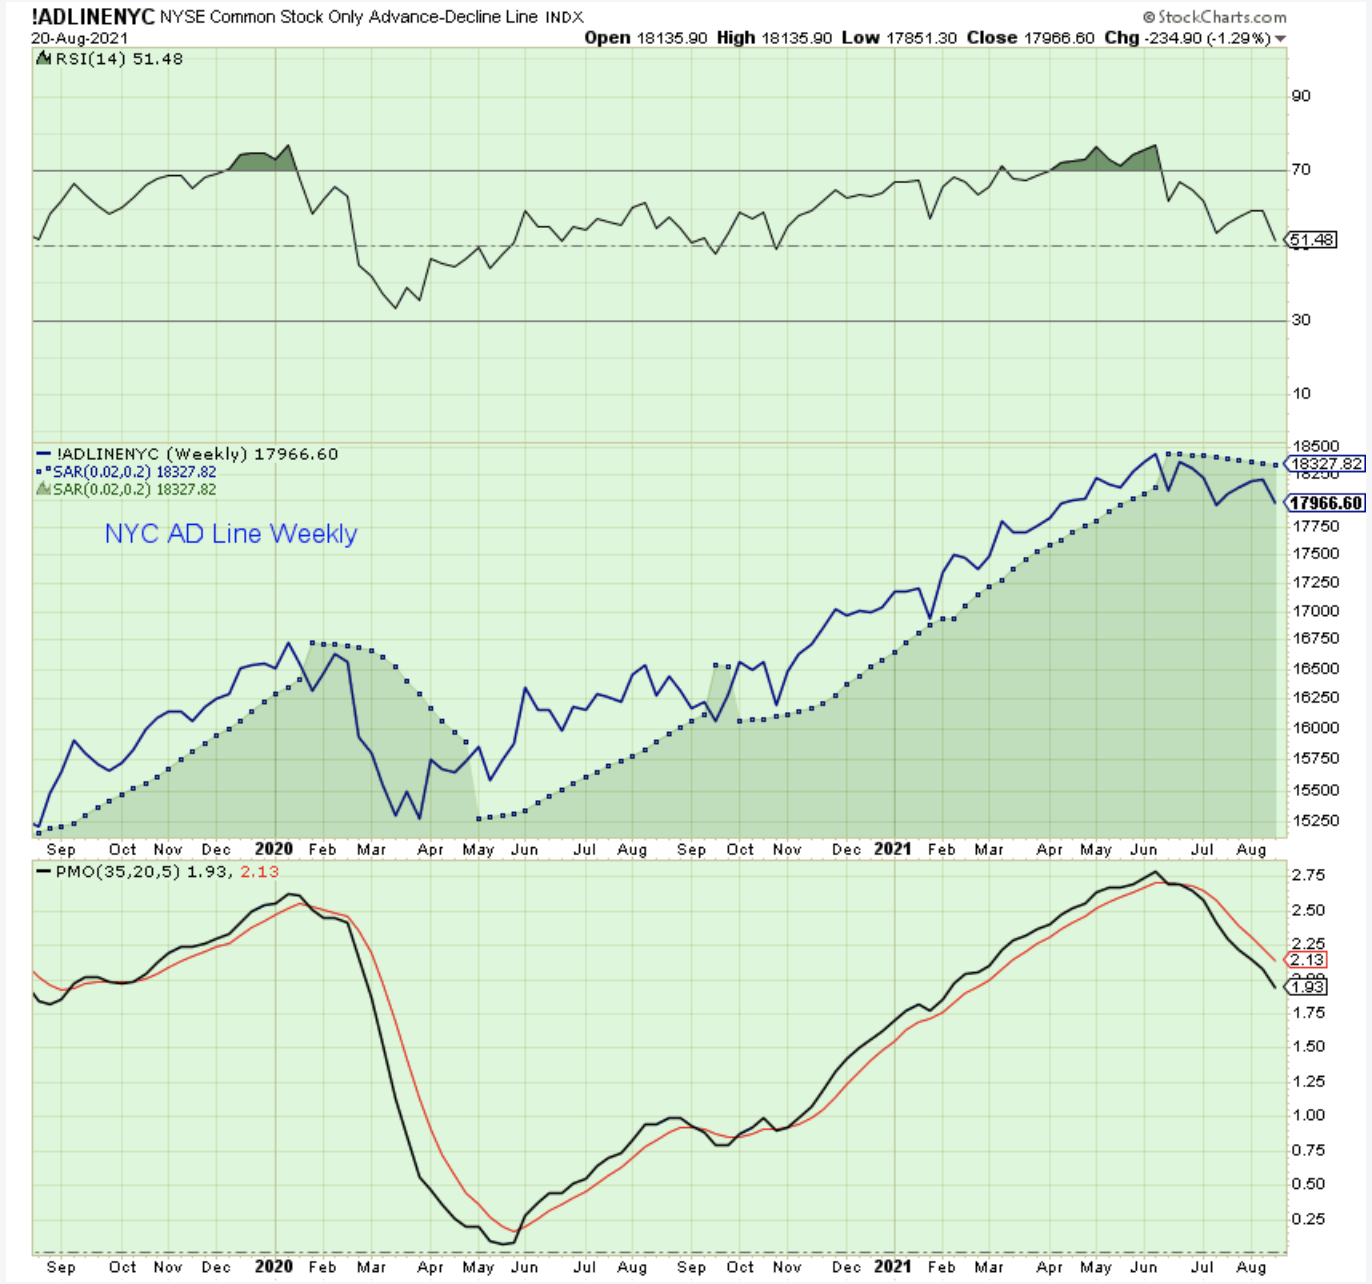
The chart below shows one reason why I'm bearish. The AD line is weak, and weakness in this line means that the stock market is vulnerable to a correction. No more needs to be said than that.
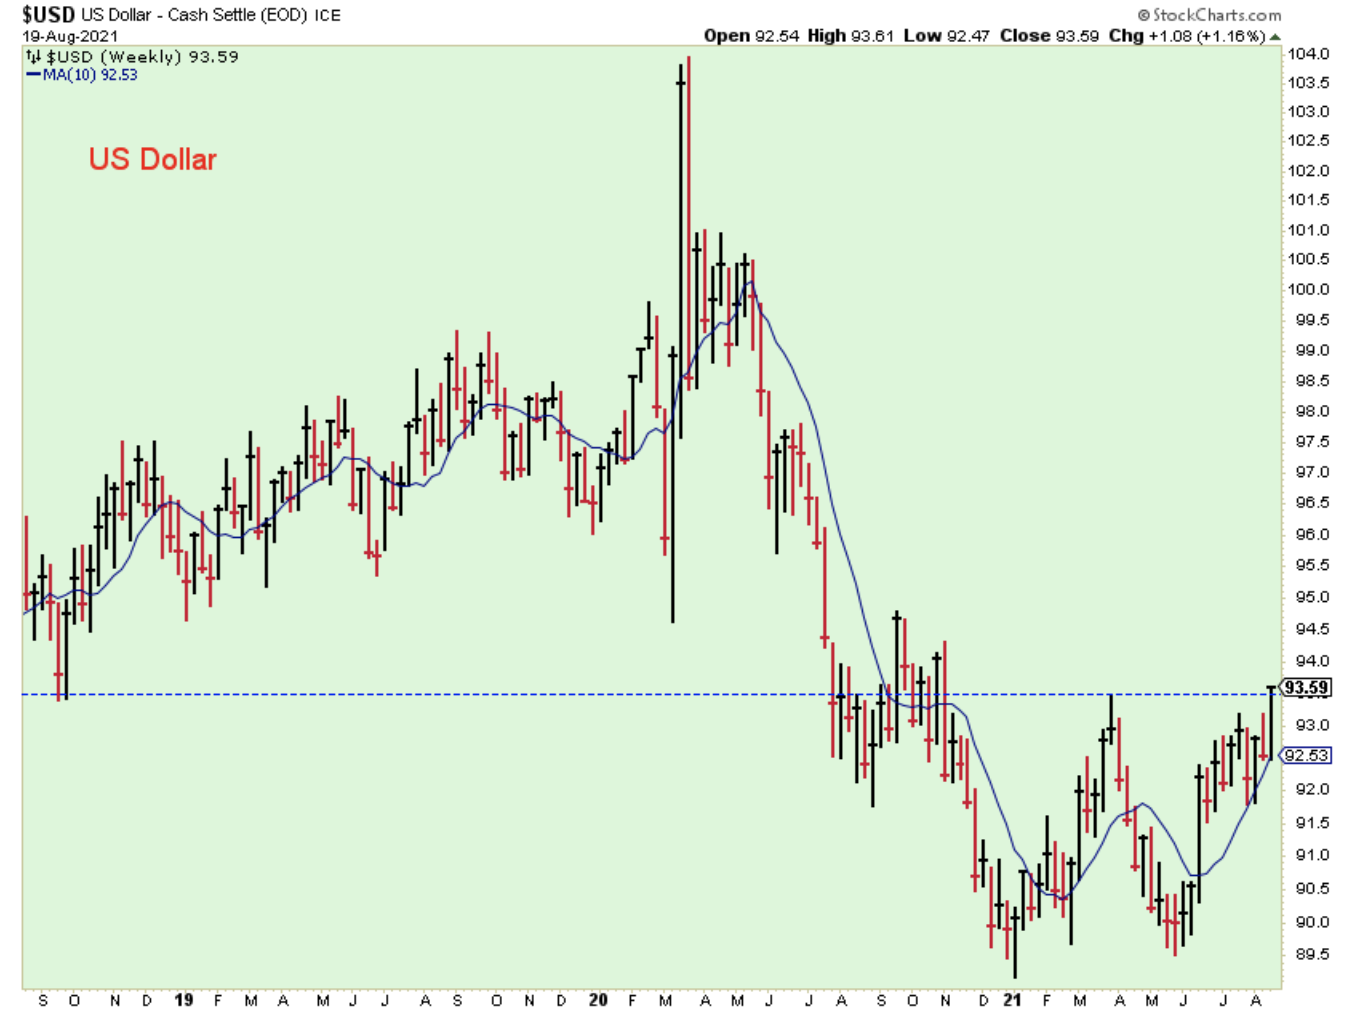
It looks like the US dollar has started to rally past its March peak, and I believe that means we should assume a shift in trend. A higher dollar works against inflation-sensitive stocks and foreign stocks.
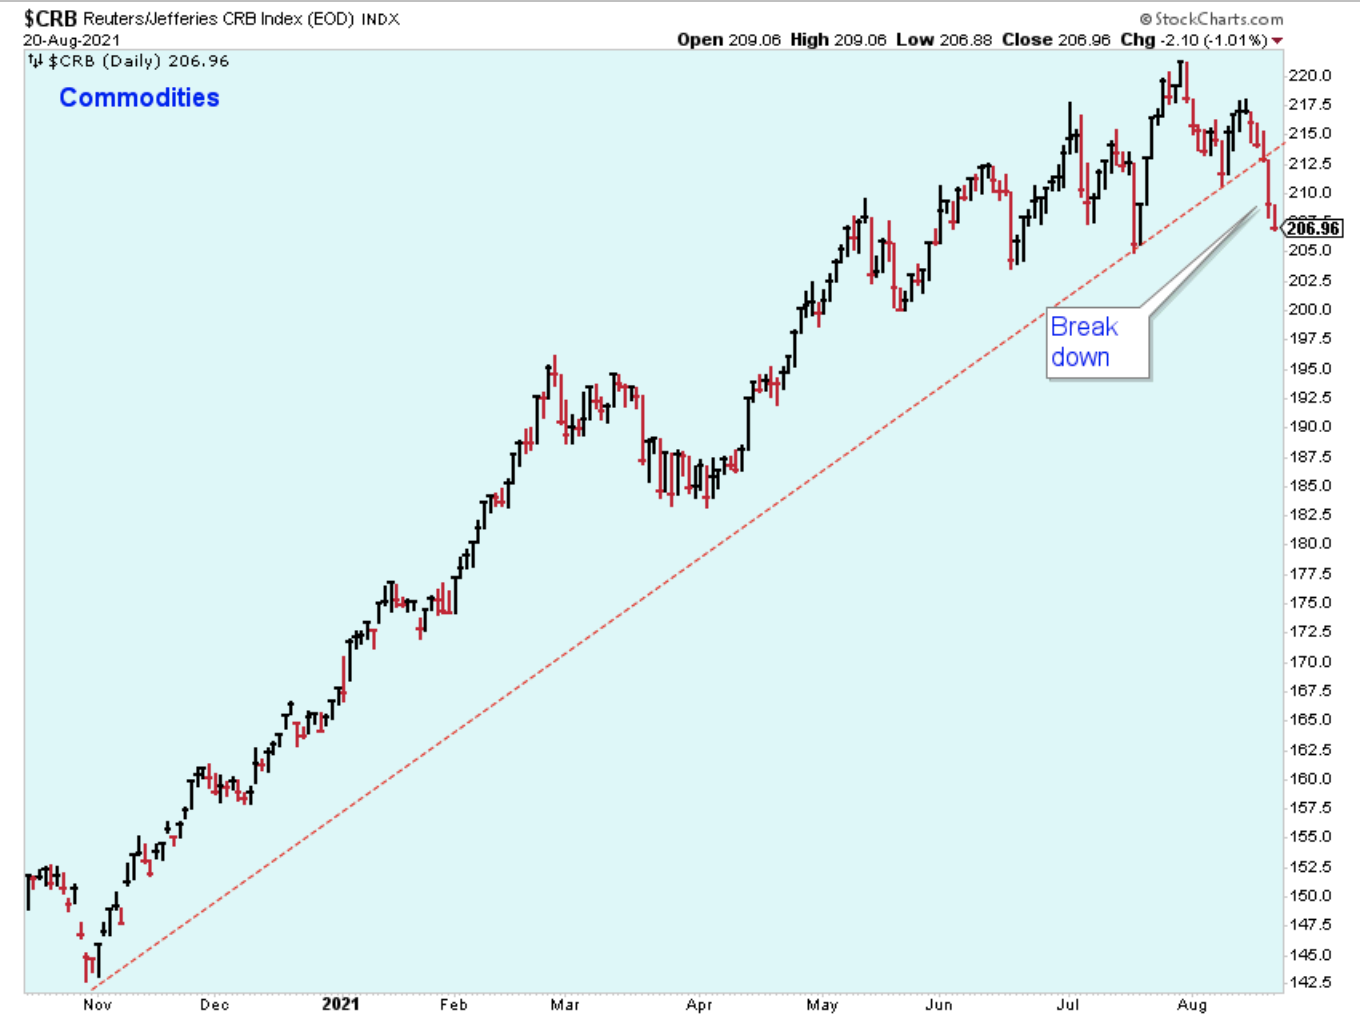
In reaction to the higher dollar, the CRB has broken down below its uptrend support. This looks decisive.
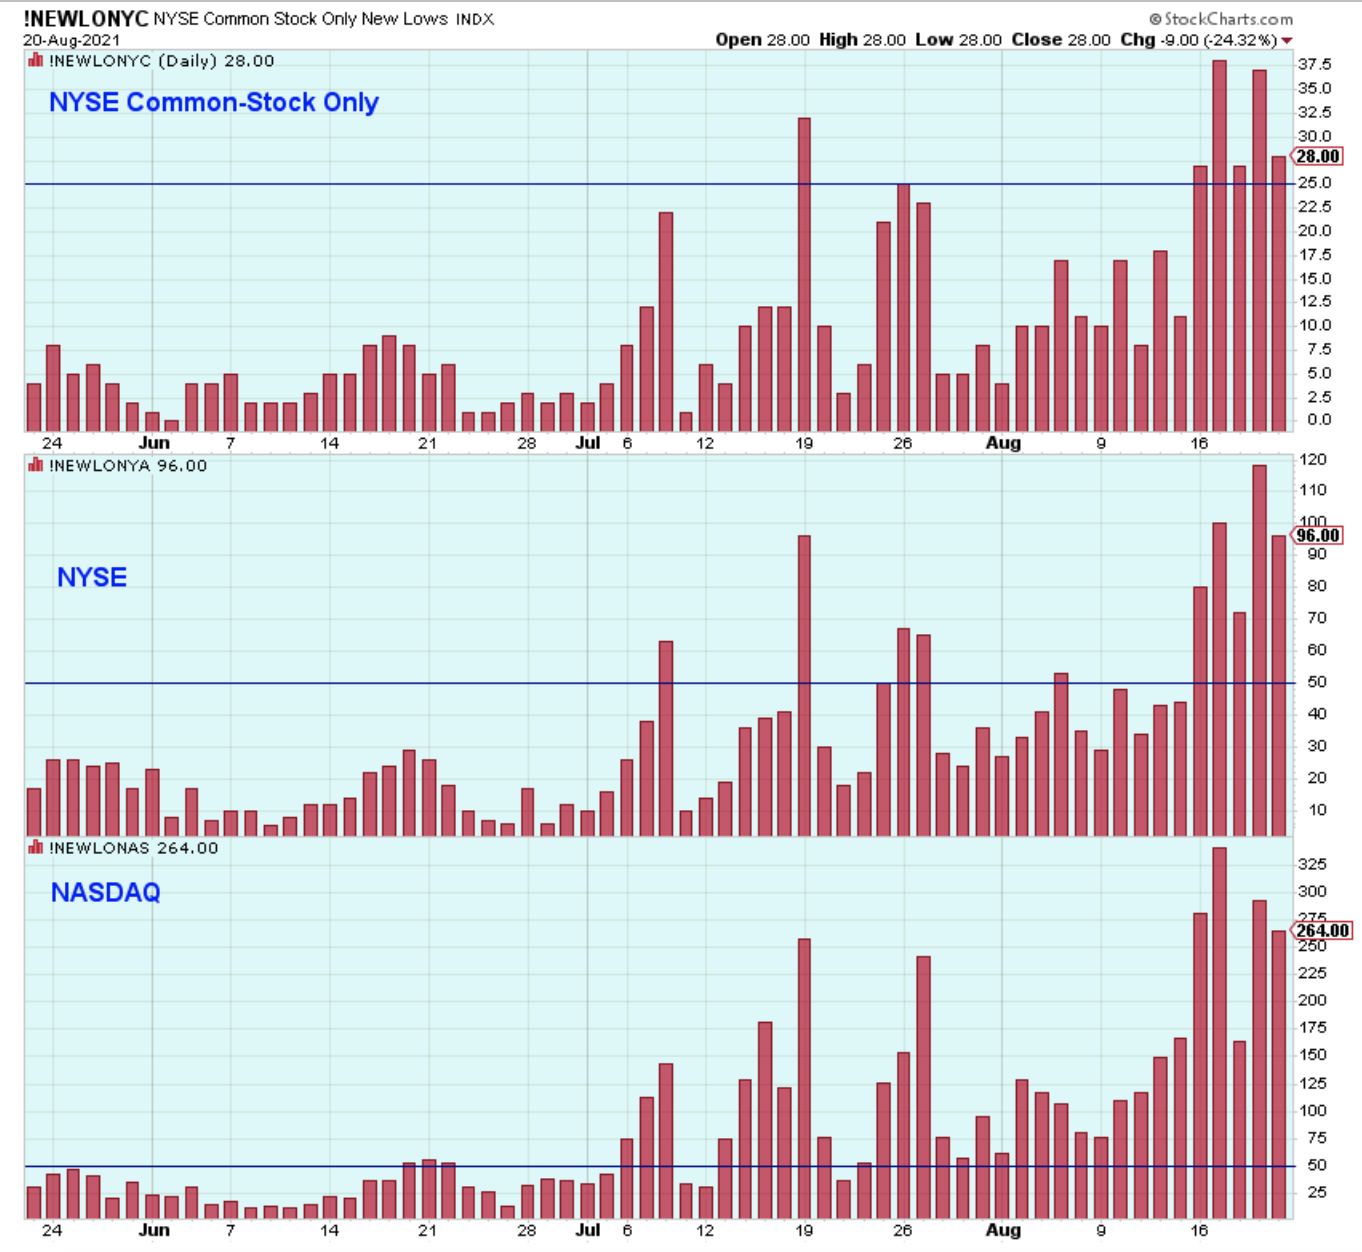
What would convince me that I'm wrong to be a bear? The answer is a sharp decline in the level of new 52-week lows. A decline in new lows similar to June would be convincing.
Outlook Summary
- The short-term trend is down for stock prices as of Aug. 12.
- The economy is in expansion as of Sept. 19.
- The medium-term trend is up for treasury bond prices as of June 11 (prices higher, rates lower).


Comments
Log in or sign up to join the conversation.