
Image Source: Unsplash
The United States Economy Continues to Grow
Some economists and politicians predicted the U.S. economy would enter a period of hyperinflation and recession or, at best, stagflation. But to date, that has not happened. The bottom line is that higher Gross Domestic Product (GDP), lower inflation, a sub-4% unemployment rate, and a higher stock market in 2023 do not indicate an imminent recession.
The GDP performed better in 2023 than in 2022 and accelerated by increasing to a 4.9% rate in the third quarter. Unless the American economy takes a sudden turn for the worse, the fourth quarter should also show growth.

(Click on image to enlarge)
Source: U.S. Bureau of Economic Analysis
Despite the negativity, the unemployment rate was still sub-4% at the end of 2023. In November 2023, the rate was 3.7%, the same percentage as November 2022.

(Click on image to enlarge)
Source: St. Louis Fed
Inflation is Muted
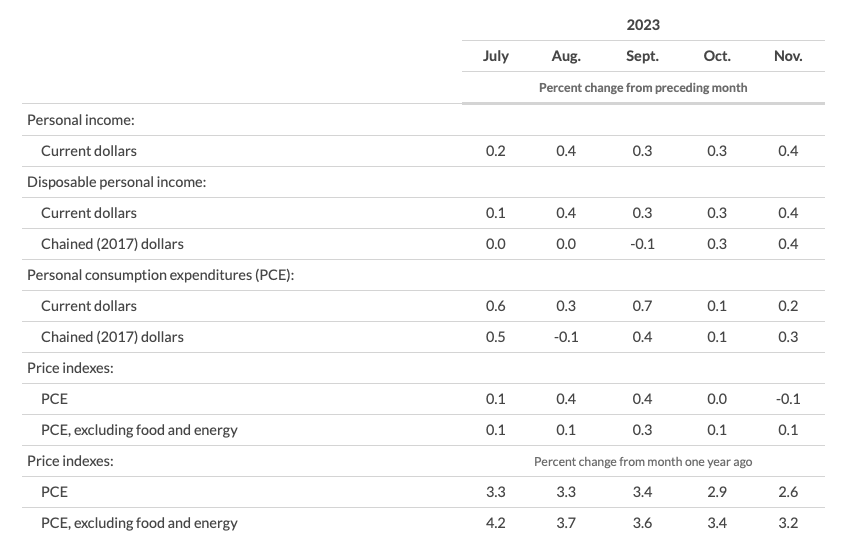
Last year, inflation reached a 40-year high. This year, the story is that the U.S. Federal Reserve has successfully brought inflation under control to between 2% and 3%. However, they are still trying to reach that magic 2% target. The Consumer Price Index (CPI) fell to 3.1% in November 2023.
The Personal Consumption Expenditures (PCE) Index did better, declining to 2.6% in November 2023. If current trends continue, the value should be attained. The Producer Price Index (PPI) shows wholesale prices are contracting, suggesting consumer prices will follow.
(Click on image to enlarge)
Source: U.S. Bureau of Labor Statistics
The primary source of inflation was the shock to the global demand and supply chain equation caused by the COVID-19 pandemic. Demand was suppressed during the pandemic, and manufacturers cut production. When demand surged, companies could not keep up, causing prices to swell. Because inflation is coming down, it is likely demand is down and supply is up.
Further, the Russo-Ukrainian War disrupted oil, gas, petrochemical, and agricultural production and flow. But seemingly, this has faded because prices have stabilized and reversed trends. One has only to look at the price of oil and gas to realize this.
Oil and Gas Prices are Down
Consumers are sensitive to the cost of gas because they must typically pay for it weekly. Last year, gas prices reached over $6 per gallon in some states, like California. Also, according to the AAA, the national average briefly went over $5 per gallon.
One year later, the story is very different. At the end of 2023, the AAA states the national average is $3.112 per gallon, after bottoming at $3.06 per gallon. The most expensive price is $4.68 in Hawaii. It is unlikely gas prices will increase much beyond seasonal fluctuations. We may even see sub-$3 per gallon, like in 2019.
Furthermore, oil prices have come down. West Texas Intermediate crude is around $71.65 per barrel. It even fell to roughly $65. Other prices are higher in the world market. But the essential point is they are lower than in 2022 when they peaked at about $120 per gallon. If they return to the same level as pre-pandemic, prices should reach sub-$60.
Currently, demand is weakening, supply is robust, and storage is full. The U.S. is the number one oil producer globally, followed by Saudi Arabia, Russia, Canada, and Iraq. Some of these countries produced record amounts of oil and have little incentive to slow down.
Granted, OPEC+ is trying to cut production, but non-OPEC countries are not. In addition, some nations need to finance wars and large budget deficits and are leveraging their nationalized oil production. As a result, despite the efforts of OPEC+, the dynamics for more oil production are still present.
Interest Rates are Still High
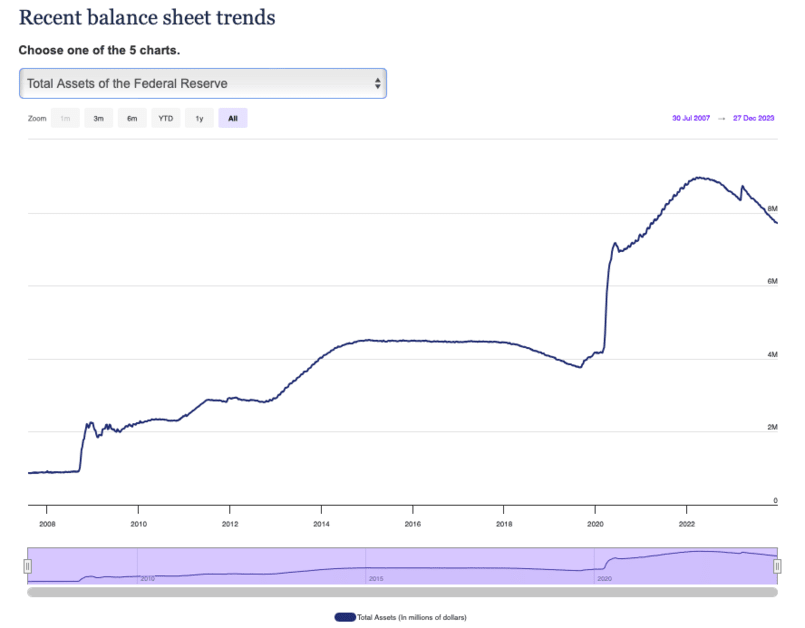
In 2021 and 2022, the central bank’s response to high inflation was to remove liquidity and raise interest rates. The Fed and Chairman Powell did so with enthusiasm. The balance sheet reached almost $9 trillion in mid-April 2022. The value is down to approximately $7.7 trillion at the end of 2023, a nearly $1.3 trillion decline. Similarly, the Federal Funds rate has risen from essentially 0% to 5.33% at year-end.
(Click on image to enlarge)
Source: U.S. Federal Reserve
The dual action caused institutional and retail investors to dump stocks and bonds in 2022. The stock market has recovered, but bond yields are still high, making many risk-free cash accounts attractive. Treasury bills and bonds from one month to two years yield more than 4%, with those at six months or less duration at 5%+.
Intermediate and long-term U.S. Treasuries are yielding 3.5% to 4.5%. In addition, U.S. Government-issued Series I Savings Bonds are paying 5.27%. Today, investors can purchase short-term bonds with excellent yields.
High Federal Funds rates have a disadvantage, which is mortgage rates. After rising since late 2021 and peaking at around 7.75%, the 30-year fixed-rate mortgage (FRM) has declined to ~6.61%.
At the same time, the 15-year FRM went over 7%, but is now down to 5.93%. High rates have caused lower builder activity and slower sales. Many people cannot afford homes at the current rates, so rent. I expect mortgage rates to trend down because the Fed has paused, and the next rate move will likely be lower.

(Click on image to enlarge)
Source: FreddieMac
The Stock Market Had an Excellent 2023
What worked for the stock market in 2021 but did not succeed in 2022 seems to have bounced back in 2023. Tech and growth stocks finished one of their best years, recording four years of gains in the last five.
The best-performing market by far was the Nasdaq Composite, gaining about 45%. The even more concentrated Nasdaq 100 Index returned almost 55%. The strong bull market was not limited to the Nasdaq, however.
The S&P 500 gained 26%, and the largest 100 S&P companies returned even more at 30%+. The other indices did not perform as well but still increased. According to data from Stock Rover, the Dow Jones Industrial Averages (DJIA) rose 13.7%, and the Russell 2000 did better at +16.8%.
The Dow 30, which is calculated based on the sum of the prices of its components, ended the year just short of its record. The other indexes and composites were close, too.
Ten of the 11 sectors had positive returns this year, led by Technology, Communication Services, and Consumer Cyclical. Interestingly, these were among the worst performers in 2022. Only the Utilities sector declined, a turnaround from last year when it was one of two with gains. The three worst performing sectors were Consumer Defensive, Energy, and Utilities.
Dividend stocks did not have a great year in relative terms, although the returns were still positive. Stocks with longer streaks struggled, while ones with shorter streaks did better. This fact is not surprising because longer streaks are usually owned by Consumer Defense and Utilities, which did relatively poorly.
The Dividend Kings were up +4.76%, the Dividend Aristocrats +8.59%, the Dividend Champions +7.05%, the Dividend Contenders +13.08%, and the Dividend Challengers +14.25%. That said, passive income streams rose, and income stocks also performed well in 2022, giving solid two-year returns.

(Click on image to enlarge)
Source: Stock Rover
Looking at the asset classes, bonds had another comparatively poor year, like in 2022. However, the total returns were positive, unlike 2022, which could have been better. Of the asset classes, long-term Treasuries did poorly, while the S&P 500 Index, developed markets, Russell 2000, and gold did well. Bonds obviously perform poorly when interest rates are rising quickly.
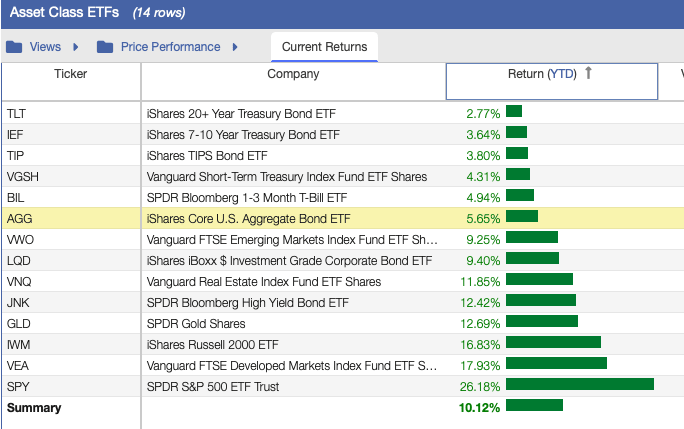
Source: Stock Rover
The 2023 Year in Review – What Have I Learned?
Crypto bounced back. I do not own cryptocurrencies. So, I avoided the volatility and turmoil. After a horrendous 2022, they bounced back in 2023. Bitcoin (BTC) boasts an approximate $800+ billion market capitalization, while Ethereum (ETH) added another $276 billion.
Despite their recovery, I still do not recommend it as a prominent investment for most people. They are high-risk and too volatile. Regulatory and fraud risks exist. One only has to Google it to discover another problem. They do not offer investors security, like savings accounts and investments in the United States, which are protected by the Federal Deposit Insurance Corp. (FDIC), National Credit Union Administration (NCUA), and Securities Investor Protection Corp (SPIC).
Cryptocurrencies are relatively new. Although touted as an inflation hedge, they did act as one in 2022 and 2023. Moreover, they seem sensitive to rising and falling interest rates. Lastly, cryptocurrencies are not easily exchanged for goods, services, or real currencies.
Warren Buffett is Usually Correct
Warren Buffett likes to say something like, “Don’t bet against America” about the economy. Specifically, in the Berkshire Hathaway 2022 annual letter, he states:
“I have been investing for 80 years – more than one-third of our country’s lifetime. Despite our citizens’ penchant – almost enthusiasm – for self-criticism and self-doubt, I have yet to see a time when it made sense to make a long-term bet against America. And I doubt very much that any reader of this letter will have a different experience in the future.”
He and Charlie Munger have backed that statement with their money. Berkshire Hathaway’s most significant holdings are U.S. Treasuries, Apple, Bank of America, American Express, Coca-Cola, and Chevron. This list does not include the host of wholly owned businesses, either.
I point this out because the American economy is performing well relative to the rest of the world after the COVID-19 pandemic. Many other countries are still recovering.
Inflation in the U.S. is lower than in the other G7 countries, most of Europe, and many countries outside of Europe. A graphic from earlier this year shows this well, as does recent data.
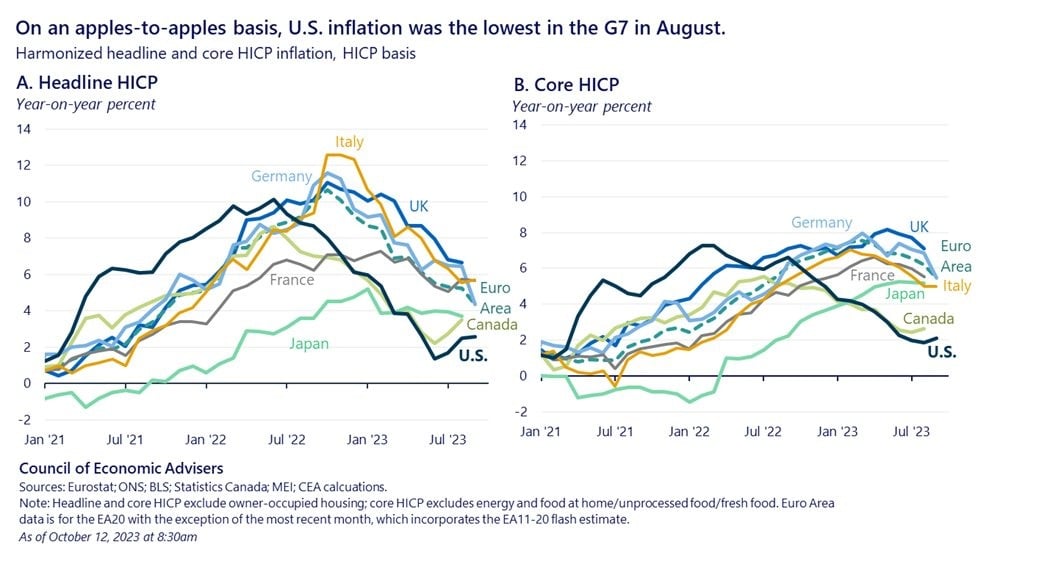
(Click on image to enlarge)
Source: Council of Economic Advisors
Next, the U.S. economy is growing faster than most G7 countries, the Euro area, and many other advanced economies. Only some emerging economies are growing faster, albeit on lower bases.
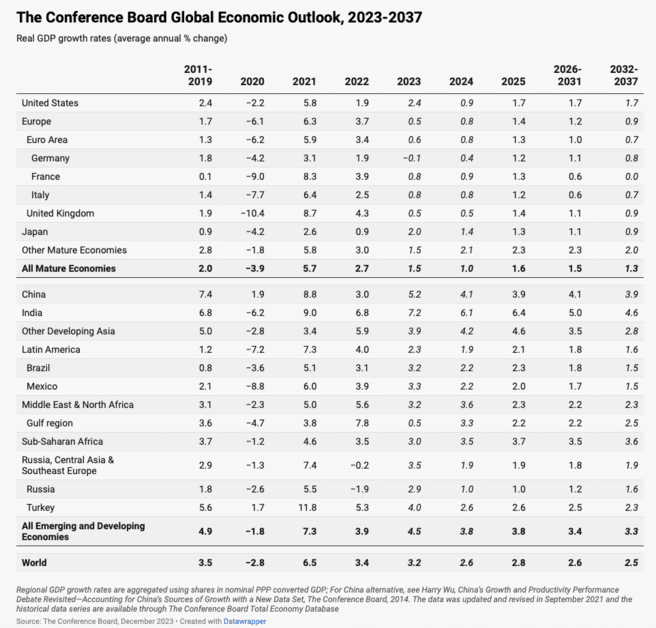
Source: The Conference Board
The 2023 Year in Review – Dividend Growth Portfolio
Most stock market indices and portfolios gained in 2023 unless you were invested solely in Utilities. The large-cap dividend growth portfolio climbed +11.45% versus the Morningstar U.S. Market Index at +24.43%. This comparison is for investor returns after accounting for reinvested dividends and additional purchases during the year.
The portfolio had eight up months and four down months. The best month was November, up +6.84%, versus +9.19% for the Index. The worst month was September, when the portfolio was down (-4.85%) versus (-4.84%) for the Index. Unlike 2022, the portfolio generally did worse on the down and up months, which is unusual and the opposite of what usually occurs.
In the past three years, the dividend growth portfolio has outperformed the Morningstar U.S. Market Index by about 0.34%. In the past five years, it underperformed by 1.35%. Since its inception, the dividend growth portfolio has outperformed the Index by about 2.9%.
The main reason for the worse short-term performance was the outsize gains of the Index in 2023 and the presence of many non-dividend paying stocks in the index with significant returns. For instance, Nvidia rose ~239%, while Meta climbed nearly 200%.
That said, the passive income stream gained 21%. The dividend growth portfolio does not include non-dividend-paying stocks. If a dividend is cut or suspended, the stock is sold.
The 2023 Year in Review – State of the Dividend Power Site
The Dividend Power site remained a popular investing site in 2023. According to Google Analytics, in 2023 (April 1 – Dec. 30), the Dividend Power site had 49,903 users and 97,350 page views. These values cannot easily be compared to the prior year because Google changed its tracking application after the first quarter.
In addition, Twitter followers increased to approximately 1,573 at the end of 2023. According to Feedspot, Dividend Power is the 11th-best dividend site and the 49th-best personal finance site.
According to Google Analytics, the top ten countries where Dividend Power’s readers are located are the United States, Canada, United Kingdom, Germany, Spain, India, Netherlands, South Korea, Italy, and Sweden in 2023. The top five countries did not change from last year, but those in places six to ten did so.
According to Google Analytics, the top ten cities where Dividend Power’s readers are located are New York, Chicago, London, Ashburn, Dallas, Atlanta, Los Angeles, Toronto, and San Jose. This list has changed since last year. Dividend Power has more readers where the city is unknown, but they are not included in this list.
More By This Author:
Stock Market This Week - Sunday, Dec. 313 Worst Performing Dividend Aristocrats In 2023
3 Worst Performing Dividend Kings In 2023


Comments
Log in or sign up to join the conversation.