SPX/VIX Ratio
SPX Monitoring purposes; Long SPX on 2/6/23 at 4110.98
Monitoring purposes GOLD: Long GDX on 10/9/20 at 40.78.
Long Term SPX monitor purposes; Neutral

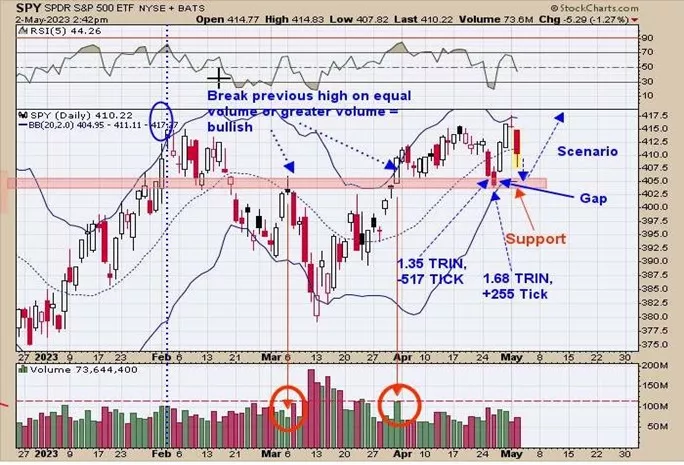
We presented this chart last week in our report. We noted the bullish tick and TRIN closes on Tuesday and Wednesday of last week and that another rally was likely coming; which it did. Thursday’s rally left an open gap near 405 SPY and most gaps get filled at some point. Notice also that the gap came at a support area (noted with a shaded pink area). SPY may try to fill last Thursday’s gap before heading higher. The gap should be tested on lighter volume and have panic readings in the TRIN for a bullish test. In the bigger picture, the SPX may try for January 2022 high near 470 in the coming weeks.

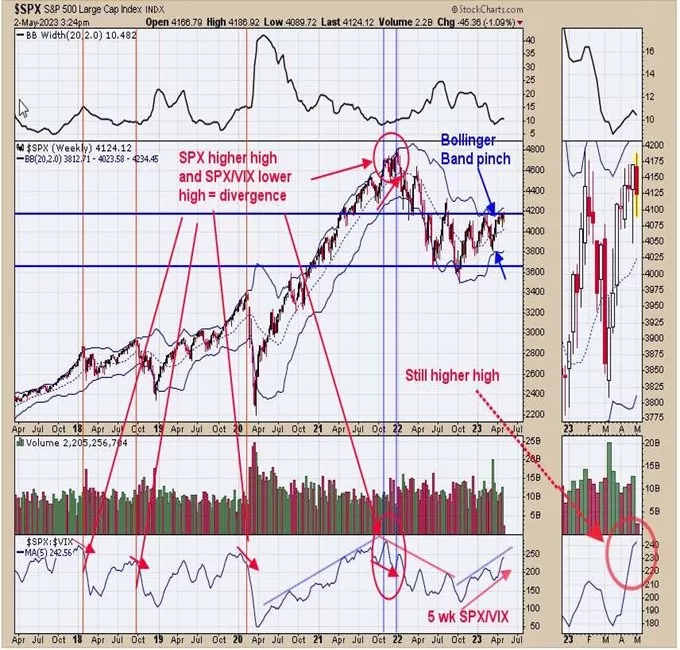
We updated this chart from yesterday and we said yesterday, “The middle window is the weekly SPX and the bottom window is the 5-period moving averages for the SPX/VIX ratio. The 5-period average for the SPX/VIX ratio has been a good indicator in helping to identify intermediate-term tops. What to look for is a divergence, where the SPX makes higher highs and the SPX/VIX ratio makes lower highs. We noted with red arrows where SPX make higher highs and the ratio made lower highs. Recently the 5 period average of the SPX/VIX ratio has made a new short term high suggesting that SPX is soon to make a new short term high. If indeed SPX does go to a new short-term high and then the SPX/VIX ratio fails to make a new short-term high is when a divergence is present. As of right now no divergence is present and the market may work higher. Notice also that the Bollinger Bands are starting to pinch on the SPX, suggesting a trending market is nearing.” The intermediate-term trend still appears to be up.

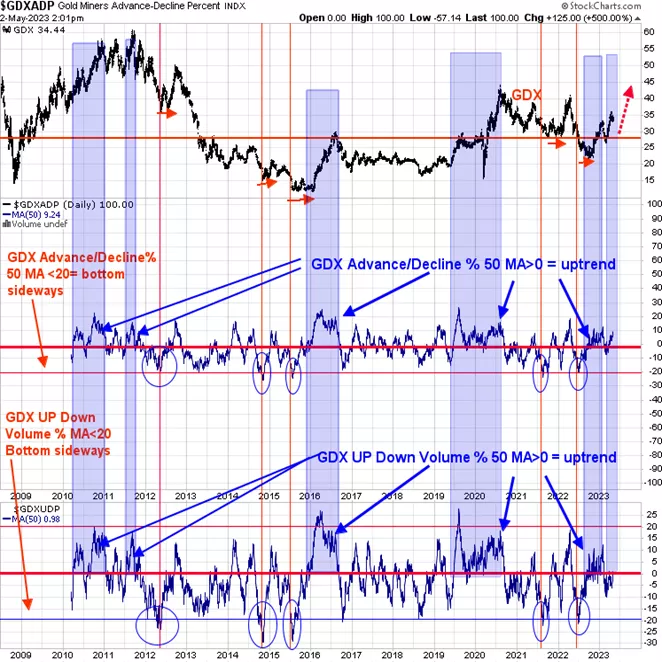
Yesterday we said, “The bottom window is the 50-day average of the Up down volume percent for GDX and the next higher window is the 50-day average of the Advance/Decline percent for GDX. We found that the 50-day average of the Up down volume percent identifies an up trend in GDX when this indicator is above “0” and stays above “0”. We noted these times with the light blue shaded area. It helps to confirm the uptrend when the 50-day average of the Up down volume percent is also above “0” but the 50-day average of the advance/Decline appears to carry the load better. Both indicators closed above “0” back in late August of last year and the 50-day average of the Advance/Decline has held above “0” in general since that time and remains above “0” currently suggesting the GDX rally has further to go.” Added to above is that 50-day average of Up down volume Percent (bottom window) closed above “0” today at +.98 suggesting the short term consolidation may be ending and an impulse wave up is beginning.
More By This Author:
"Sign of Strength"Slow Stochastic Oscillator
“Rate Of Change”
Signals are provided as general information only and are not investment recommendations. You are responsible for your own investment decisions. Past performance does not guarantee future performance. ...
more


