
SPDR Select Sector Fund ETF – XLF Elliott Wave Technical Analysis
SPDR Select Sector Fund ETF – XLF Elliott Wave Technical Analysis
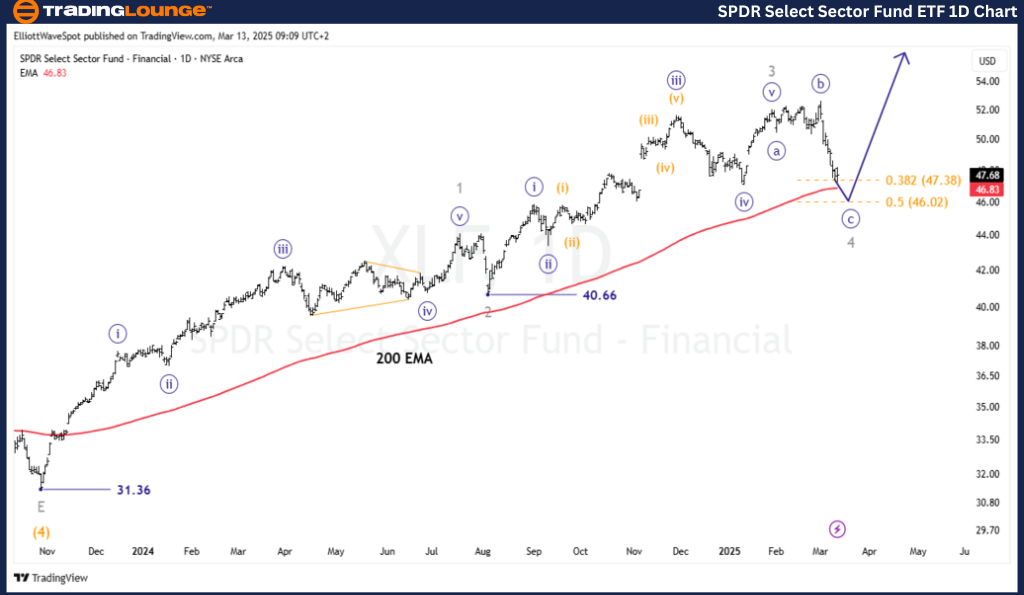
Daily Chart Analysis
- Function: Major Trend
- Mode: Motive
- Structure: Impulse Wave
- Position: Wave 4 (Grey)
- Direction: Mini Decline
Details:
- The bearish trend remains in force, heading towards the completion of wave [c] of a flat wave 4.
- Wave 4 is expected to bottom between $46.02 and $47.38, aligning with the most common Fibonacci retracement levels for wave 4 (38.2% & 50%) and the 200 EMA, which acts as support.
- Confirmation of a reversal will occur if the price breaks above $48.00.
- After the wave 4 bottom, a 5th wave rally is anticipated, pushing prices above the origin of wave 4.
- Invalidation Level: Any decline below $44.00 raises doubts about the current Elliott Wave count.
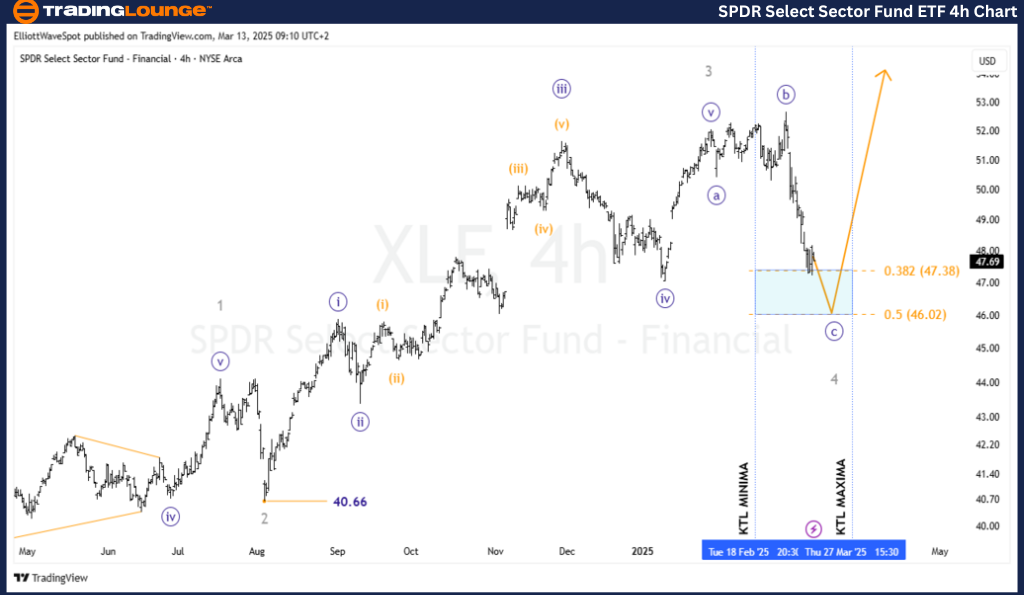
4-Hour Chart Analysis
- Function: Minor Trend (Grey)
- Mode: Corrective
- Structure: Impulse
- Position: Wave [c] (Navy) of Wave 4 (Grey)
- Direction: Downtrend
Details:
- A rally should resume once the wave [iv] throwback is completed.
- Wave iv is expected to end within the highlighted Fibonacci levels.
- The Kennedy Blue Box, a common reversal zone for 4th waves, is in play, suggesting a similar expectation here.
- If the decline reaches 50%, entering long positions at the 38.2% retracement with a stop-loss below the 61.8% level is a viable strategy.
- The minimum target is set at $52.50.
- Invalidation Level: Any drop below $44.00 would raise doubts regarding the current wave count.
Conclusion
- The wave decline in XLF continues, and the correction phase is nearing completion.
- Once the correction ends, the market should rally above the origin of wave 4.
- This presents a strong opportunity for ETF traders looking to go long.
- Following Elliott Wave rules and monitoring invalidation levels is crucial to avoid potential losses.
Technical Analyst: Siinom
More By This Author:
Elliott Wave Technical Analysis: Euro/U.S. Dollar - Thursday, March 13
Bitcoin Crypto Price News Today Elliott Wave Technical Analysis
Expert Elliott Wave Analysis: S&P 500, Nasdaq 100, DAX40, FTSE 100 & ASX 200 Trading Insights
At TradingLounge™, we provide actionable Elliott Wave analysis across over 200 markets. Access live chat rooms, advanced AI & algorithmic charting tools, and curated trade ...
more
How did you like this article? Let us know so we can better customize your reading experience.

Comments
Leave a comment to automatically be entered into
our contest to win a free Echo Show.

