

Image Source: Pexels
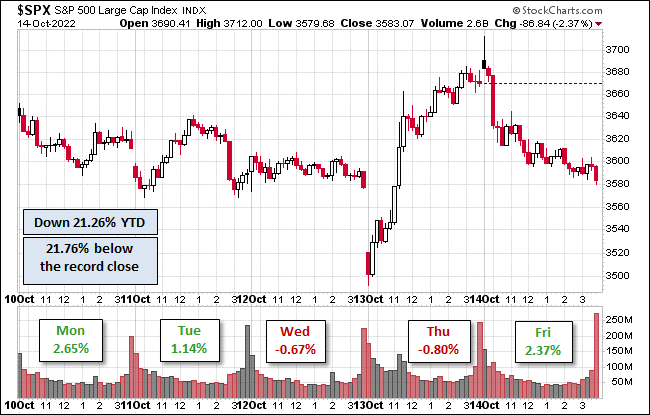
The S&P 500 had gains three out of five days this past trading week and was up 4.7% from last Friday. The index was still in bear territory: 21.8% below its record close.
The U.S. Treasury puts the closing yield on the 10-year note as of Oct. 21 at 4.21%, which is above its record low (0.52% on Aug. 4, 2020). The 2-year note is at 4.49%. See our latest Treasury Snapshot here.
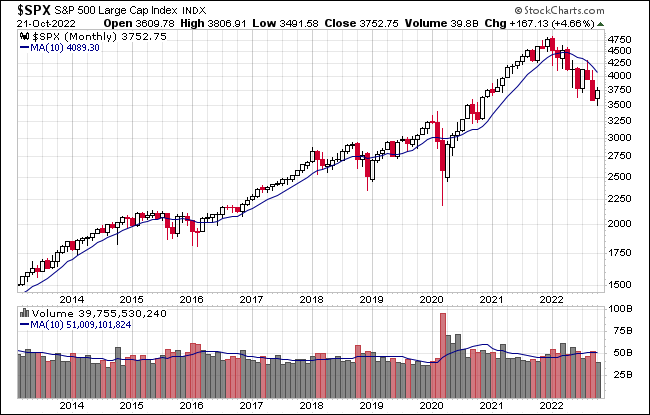
Here's a snapshot of the index going back to 2012.
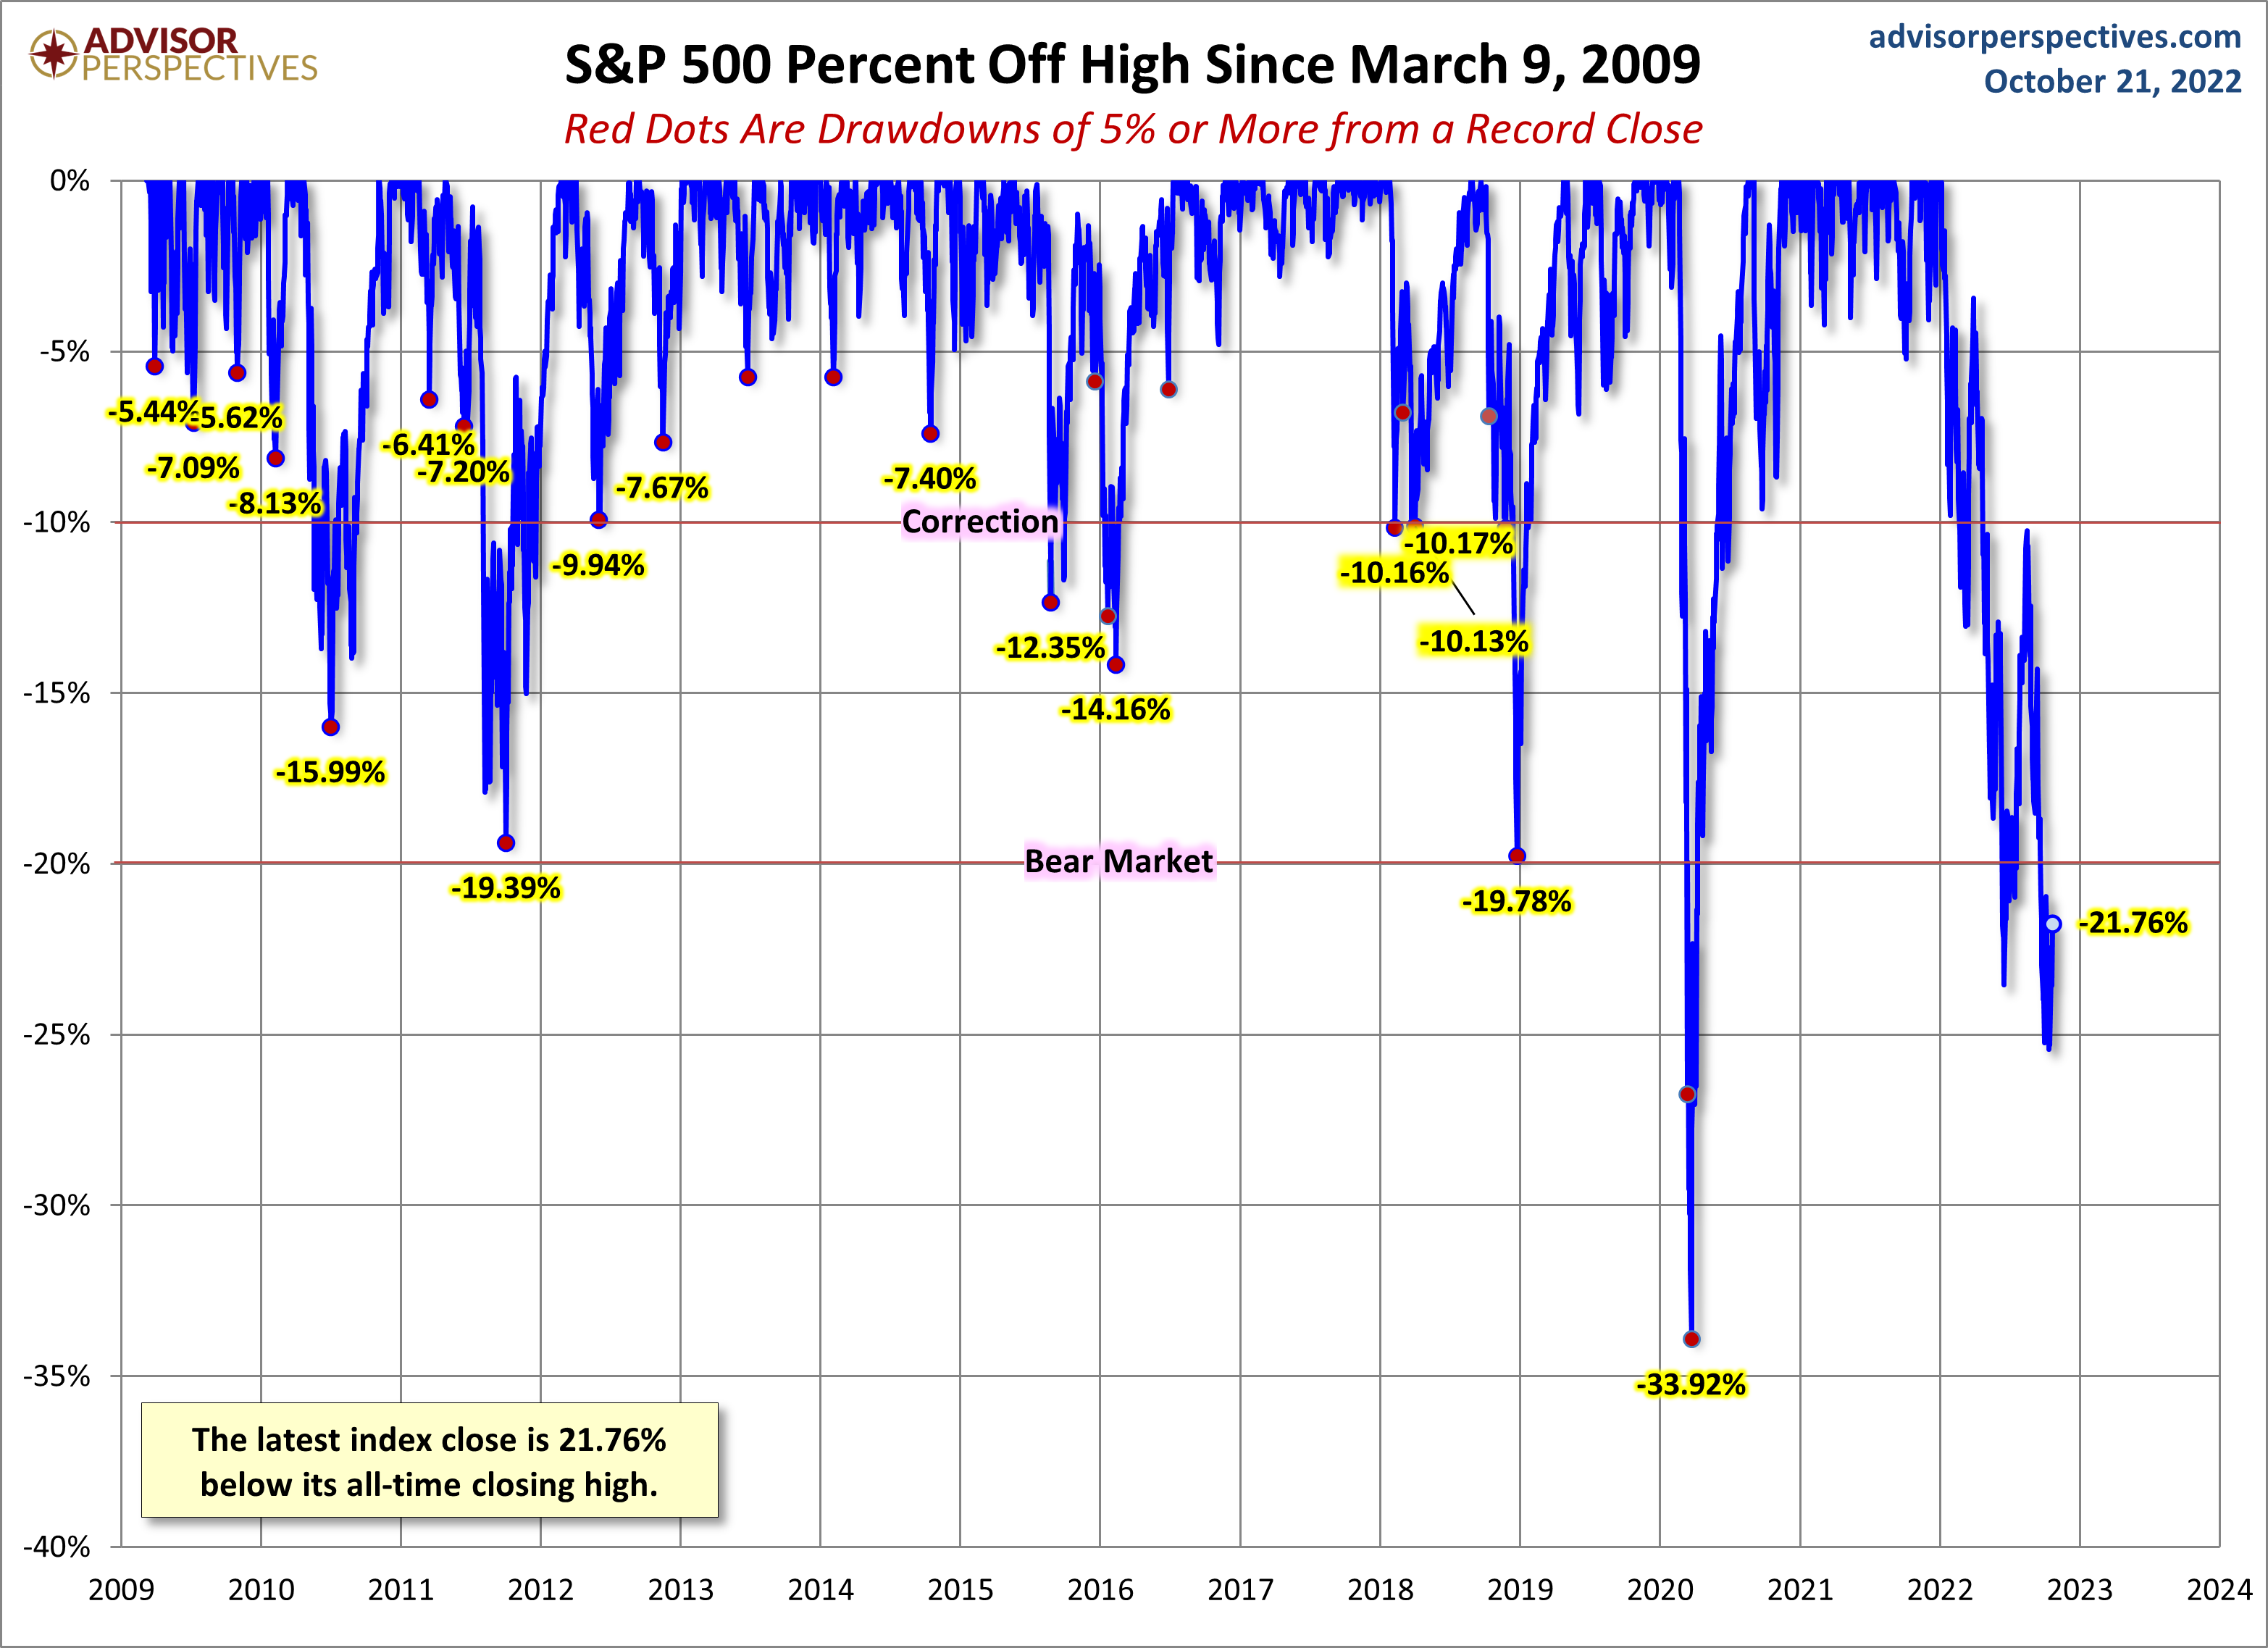
A Perspective on Drawdowns
Here's a snapshot of record highs and selloffs since the 2009 trough. Note the recent selloffs in 2022.
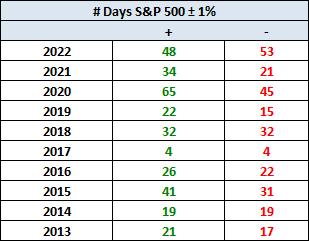
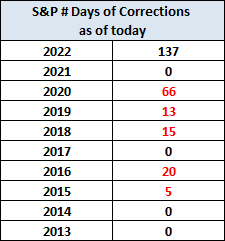
Here's a table with the number of days of a 1% or more change in either direction, and the number of days of corrections (down 10% or more from the record high) going back to 2013.
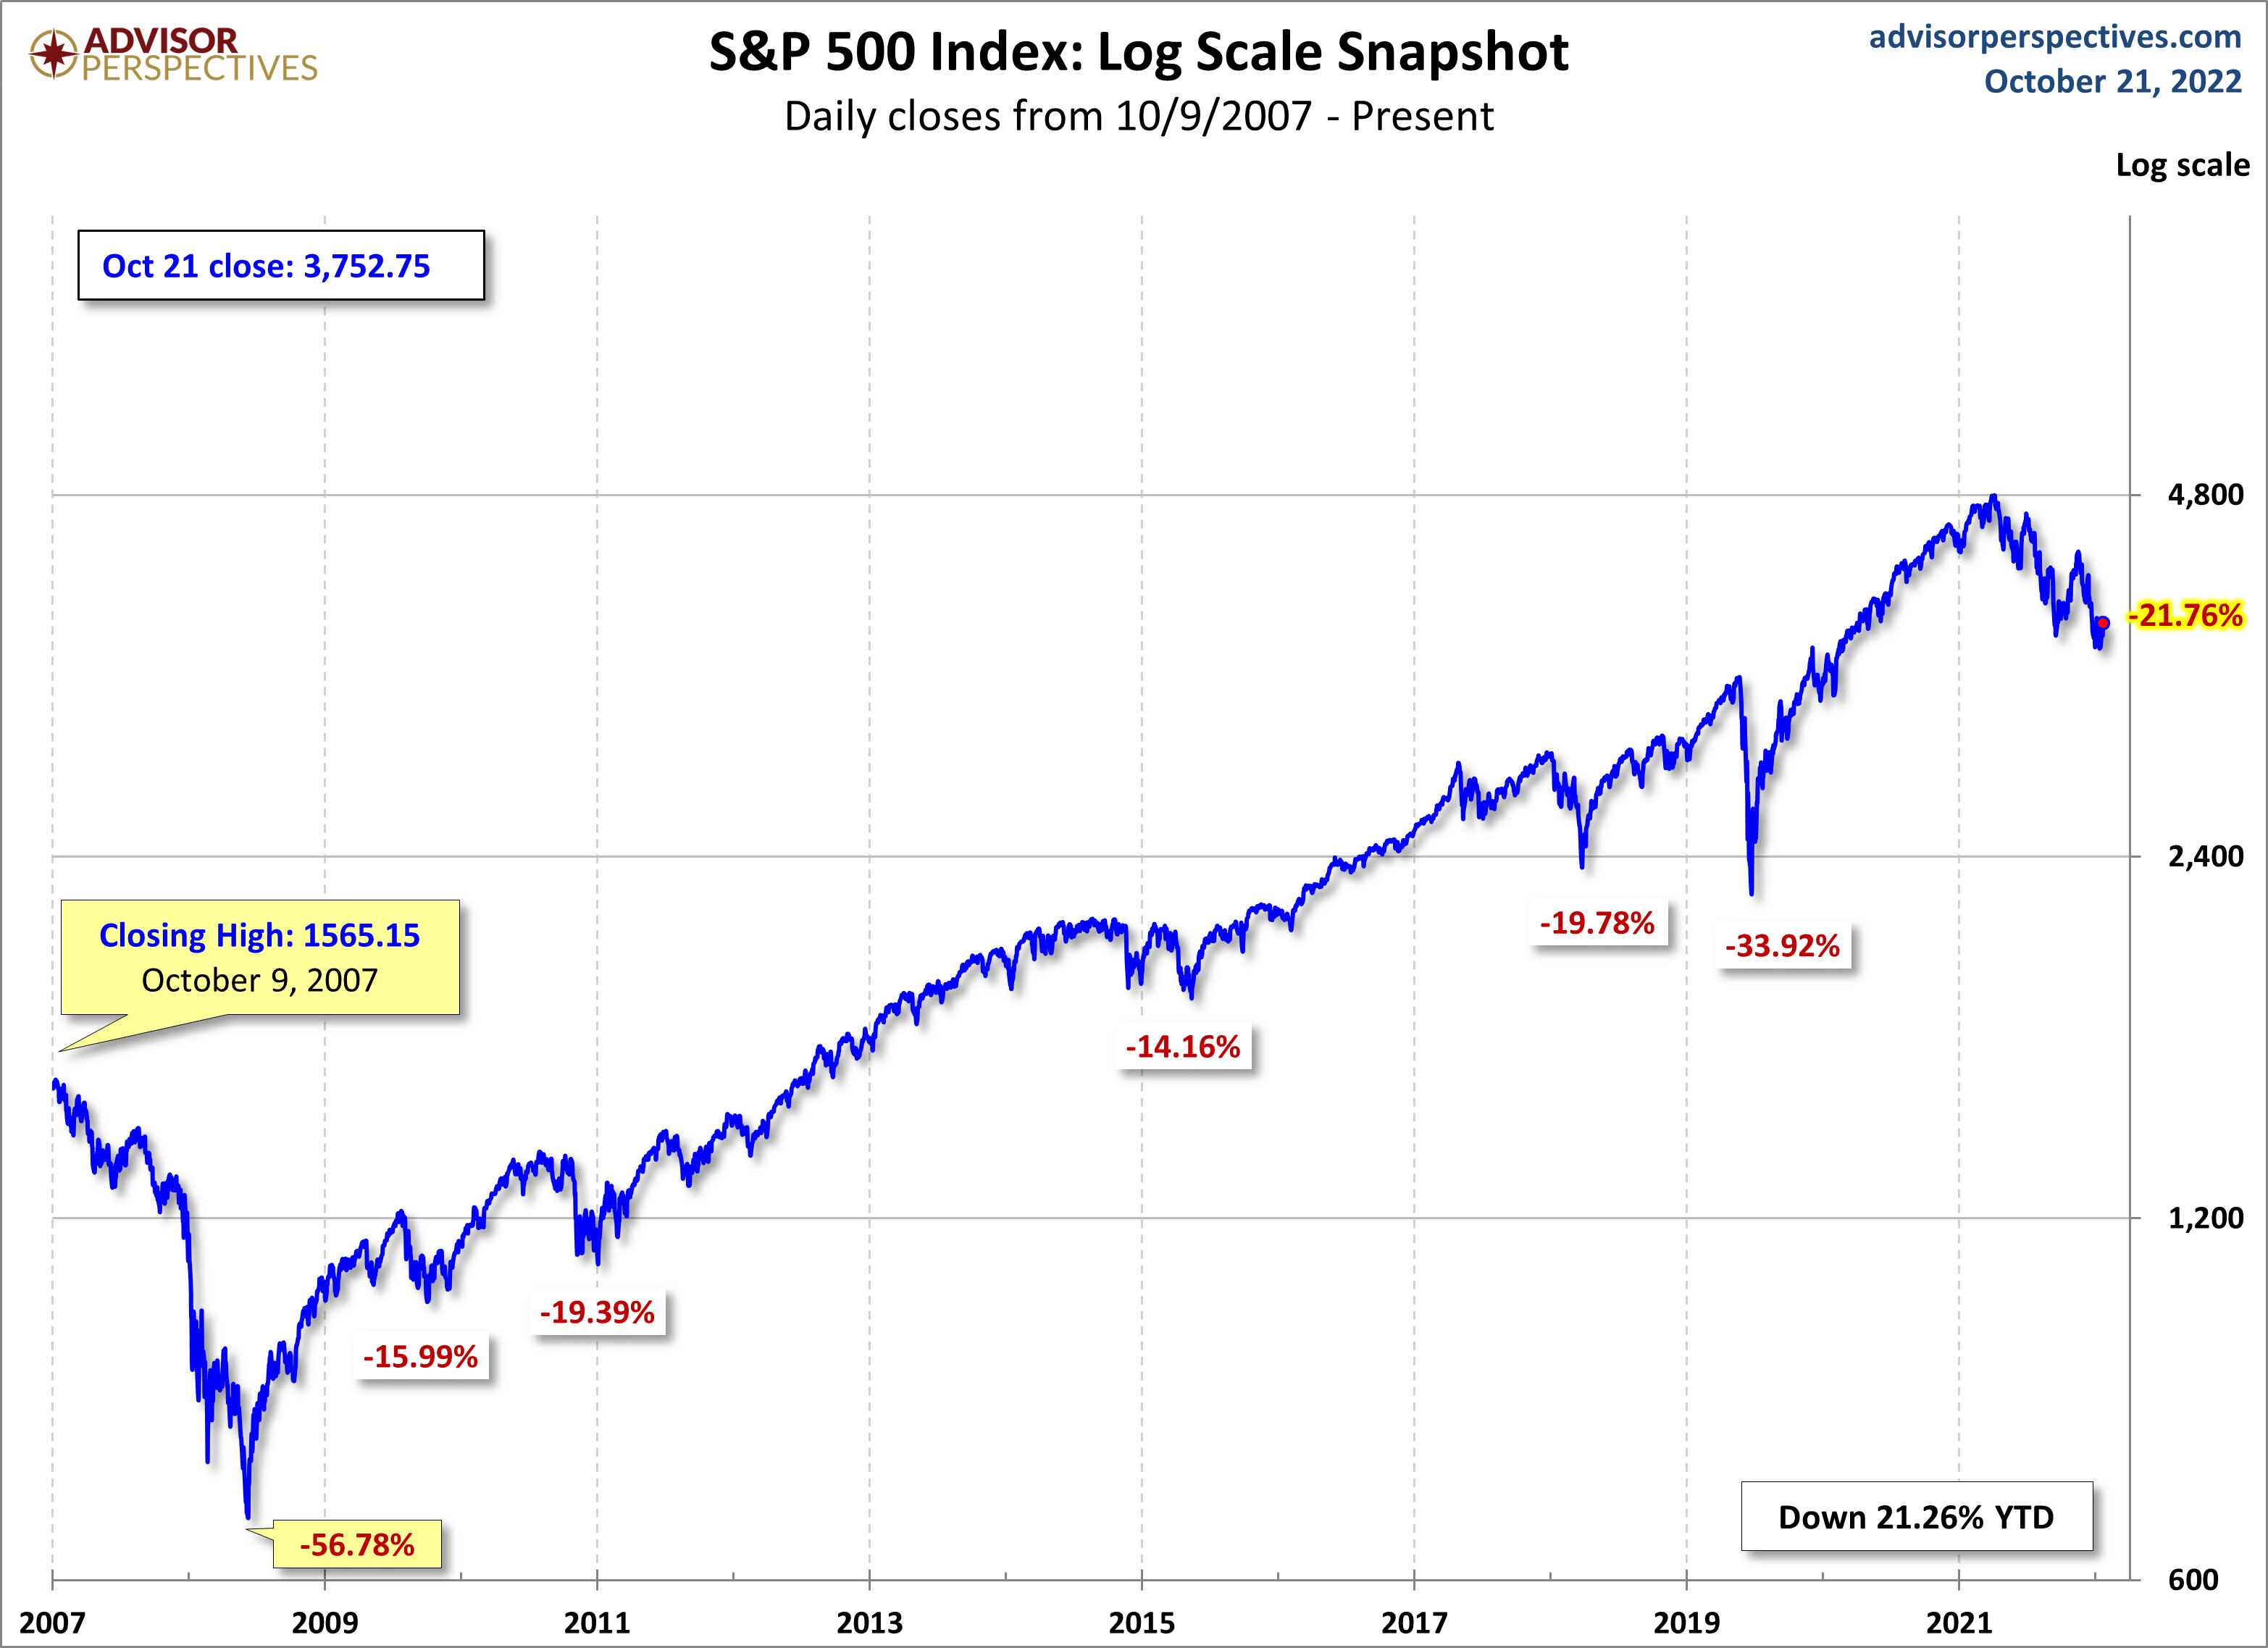
Here is a more conventional log-scale chart with drawdowns highlighted.
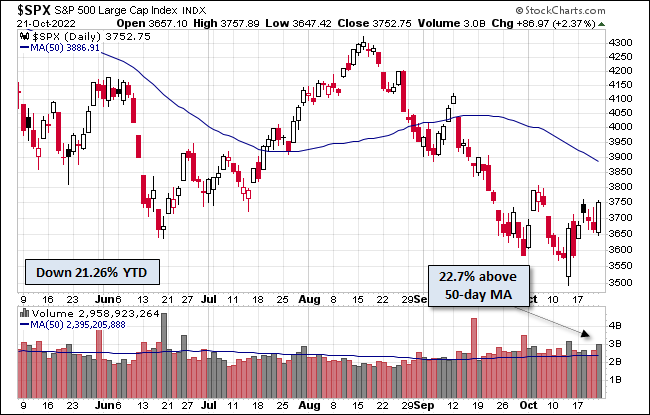
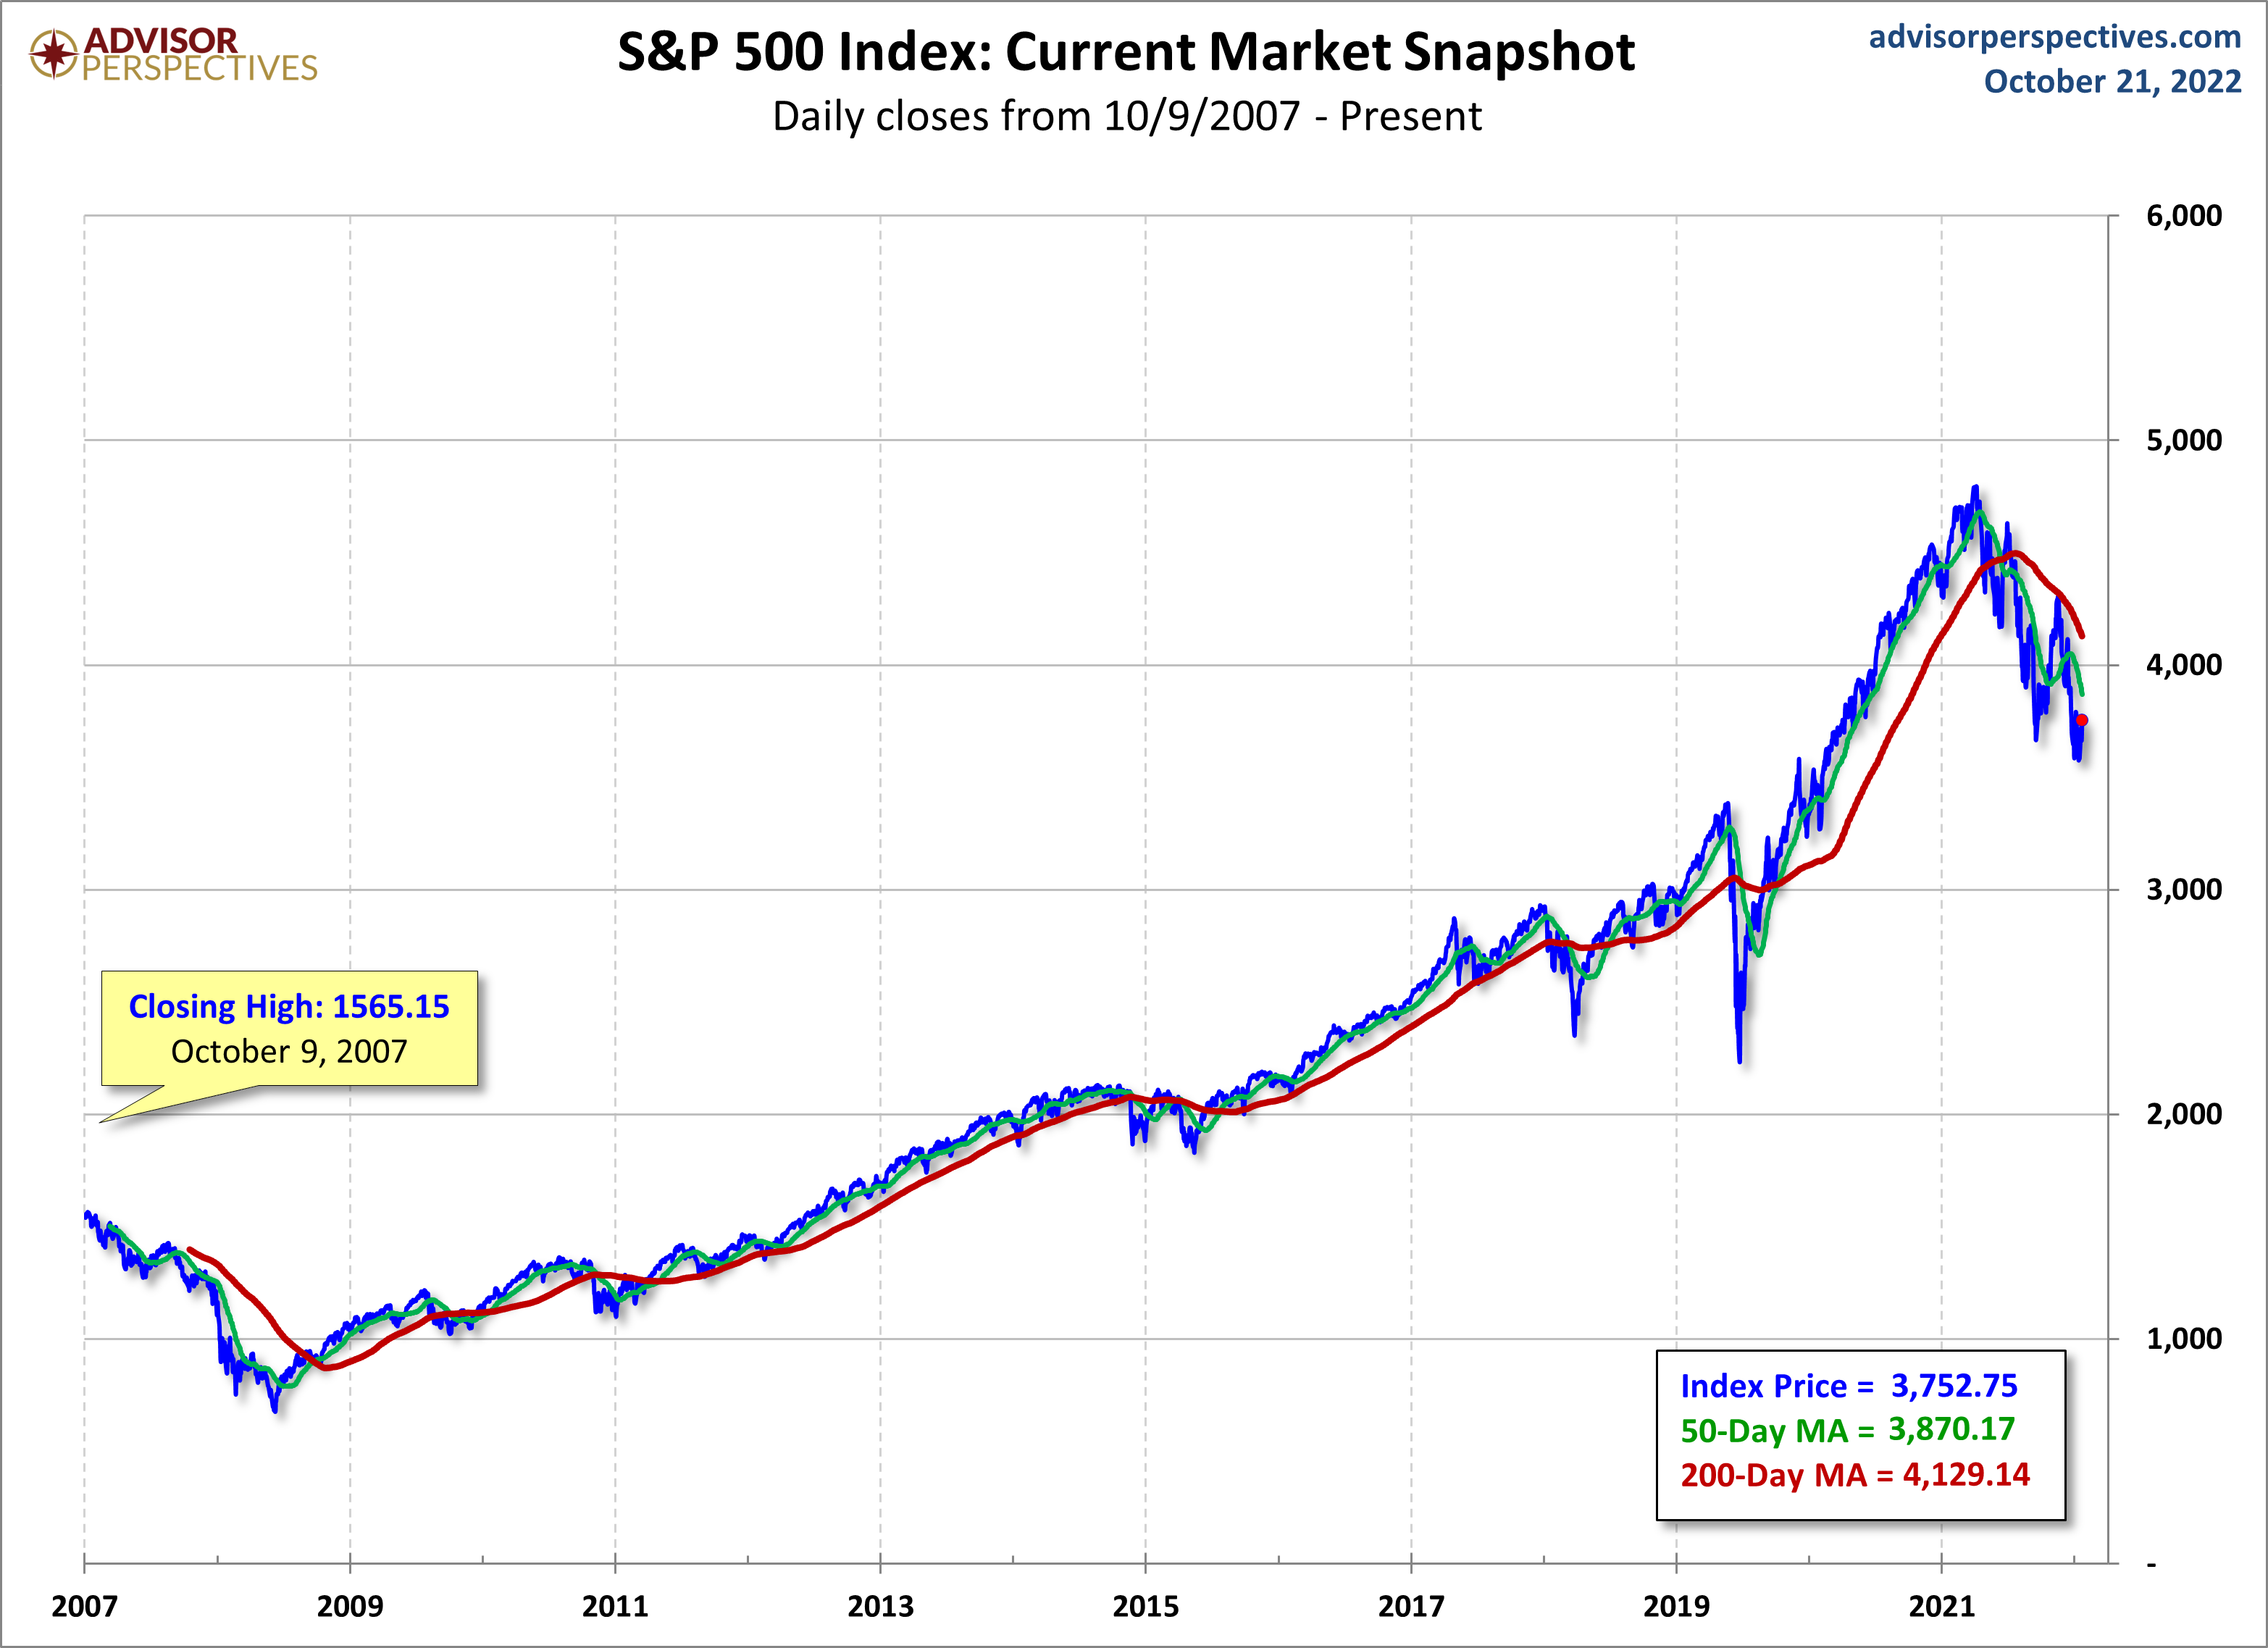
Here is a linear scale version of the same chart with the 50- and 200-day moving averages.
A Perspective on Volatility
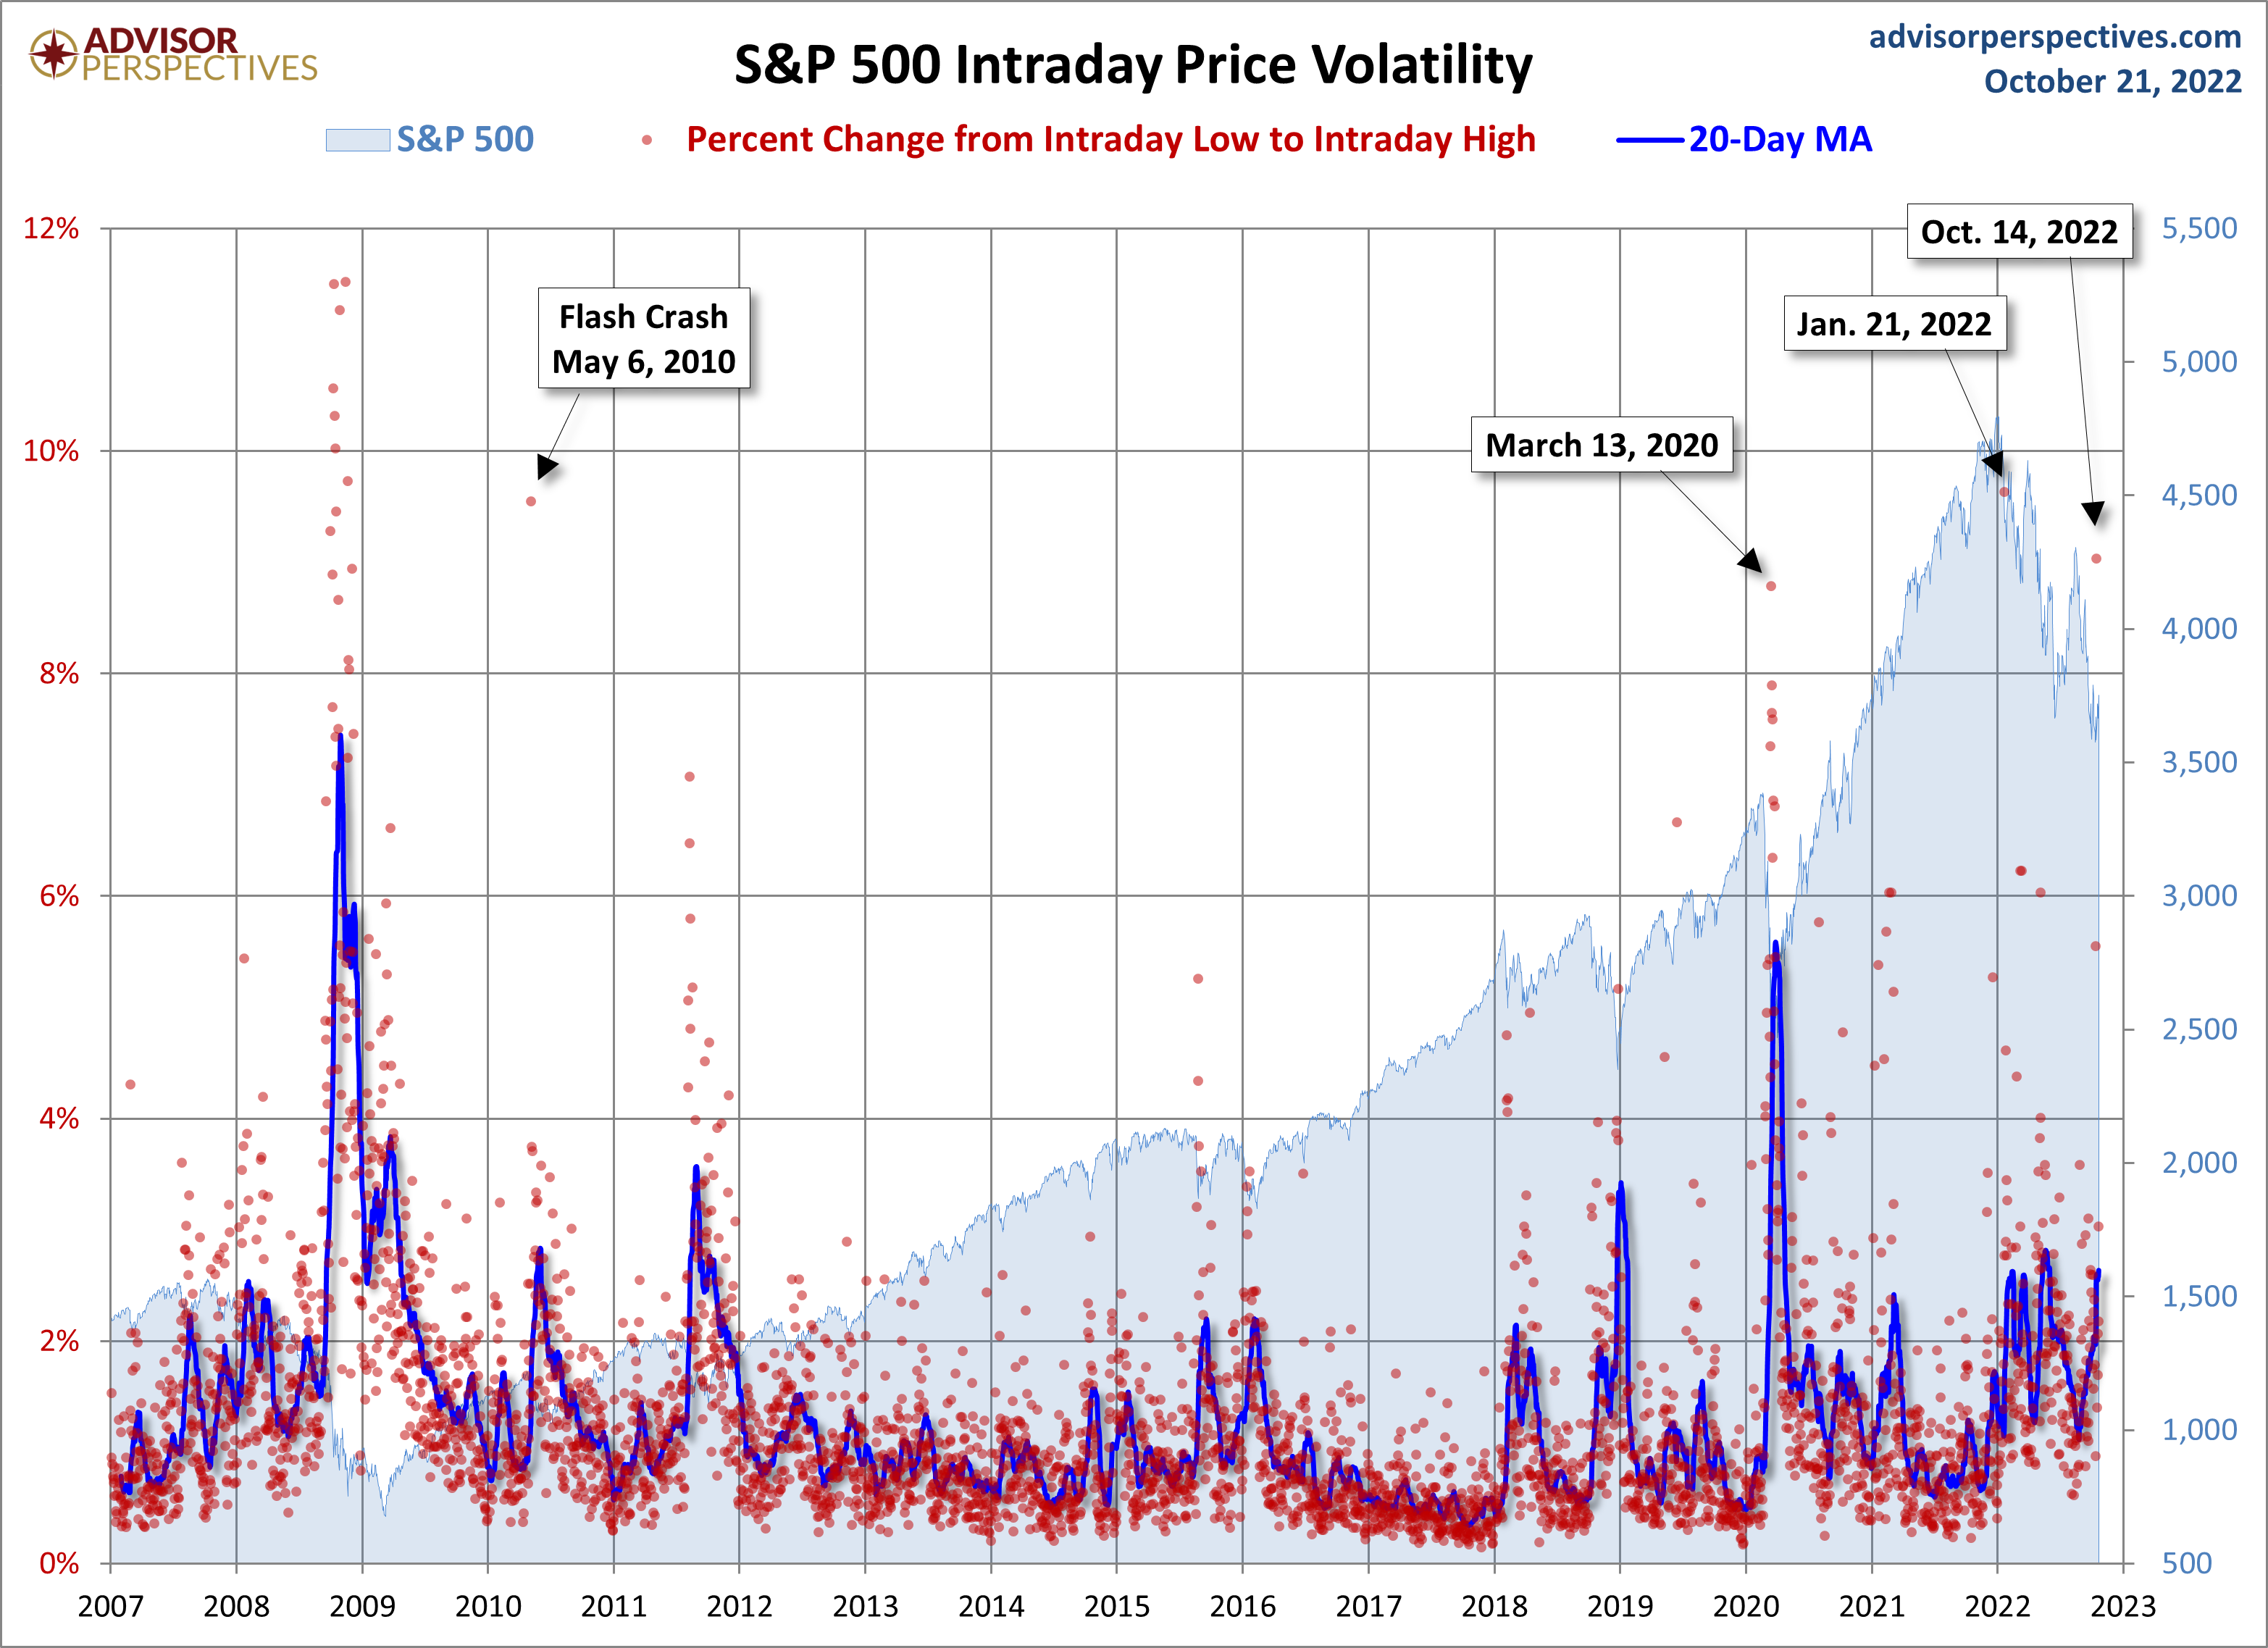
For a sense of the correlation between the closing price and intraday volatility, the chart below overlays the S&P 500 since 2007 with the intraday price range. We've also included a 20-day moving average to help identify trends in volatility.
More By This Author:
Long-Term Trends In Employment By Age Group
Treasury Snapshot: FFR Up Again
Margin Debt Down 3.5% In September


Comments
Log in or sign up to join the conversation.