
U.S. stocks suffered a sharp sell-off at the start of the week, following similar declines overseas on widespread bearish sentiment unleashed by concerns of a collapse of Evergrande, one of China’s largest property developers and reportedly the most indebted real estate company in the world with more than $300 billion in liabilities.
At the market close, the S&P 500 fell 1.7% to 4,357 while the Dow Jones tanked 1.8% to 33,970. Meanwhile, the Nasdaq 100 also sustained heavy losses, plummeting 2.1% to 15,012 as nervous investors headed for the exits and increased demand for safe-haven assets (e.g., US treasuries).
Wall Street fears that a default by the beleaguered Asian firm will spill over into the region's housing market, hurt the lending sector, batter confidence, and damage the Chinese economy, triggering a financial crisis of broad proportions. While it is unlikely that the Chinese authorities will eventually let the situation get out of hand, their lack of response and public assurances are certainly causing anxiety and depressing risk appetite.
At the same time, uncertainty about the path of U.S. monetary policy ahead of the FOMC meeting appears to be reinforcing the defensive mood, in the midst of extreme complacency and frothy valuations, at a time when the S&P 500 had not experienced a significant pullback of 5% or more in nearly 12 months.
On Wednesday, the Federal Reserve will announce its September policy decision. No change in interest rates is expected, but the bank may provide “advance notice” that the process to reduce the pace of asset purchases will commence soon.
Considering that the central bank has heavily choreographed its intention to start tapering quantitative easing this year, attention is likely to fall on the dot plot, particularly as the institution is set to introduce the 2024 projections.
Given that a rising chorus of policymakers are concerned about the trajectory of inflation, judging by the recent narrative hitting the airwaves, it would not be surprising if some members shifted their dots higher and penciled in tighter monetary policy for the next three years (for reference, if only two Fed members were to move up their dots for 2022, the median expectation for that year would increase).
A hawkish surprise in the dot-plot diagram could lift US treasury yields and weigh on rate-sensitive technology companies with high valuations. This, in turn, could trigger a downside move in the S&P 500 due to its heavily tech-oriented composition.
Despite the risk of larger pull-back or at least some near-term underperformance in the S&P 500, there may still be good opportunities out there, but investors will need to be more selective when constructing their portfolios. That said, the transportation sector, particularly the airline industry seems attractive and provides a compelling risk/reward profile over the medium term.
Since March/April, airline stock prices have been walloped by rising COVID-19 cases and weak travel demand. However, with fears for the delta-variant abating and coronavirus infection counts declining as vaccination expands, the industry’s recovery could gain momentum, especially as the Biden administration prepares to revoke its travel ban on visitors from 33 countries in November (the White House announcement that it will lift travel restrictions for international visitors who are fully vaccinated may be the reason some airlines are trading higher despite the overall weakness in the stock market).
Loosened travel restrictions will boost revenues and help many airlines achieve profitability in the coming quarters, as many commercial carriers with extensive international flights derive approximately one-third of their revenues from these routes. The improving outlook for the travel segment means that sold-off names such as American Airlines (AAL), Delta Airlines (DAL), Southwest Airlines (LUV), and United Airlines Holdings (UAL) can assume leadership and command strength over the medium term. To avoid company risk that can arise from poor management execution, the bullish thesis for air travel can be approached via the JETS EFT (this is a passively managed ETF that gives traders/investors access to the global airline industry, including airline operators and manufacturers).
JETS TECHNICAL ANALYSIS
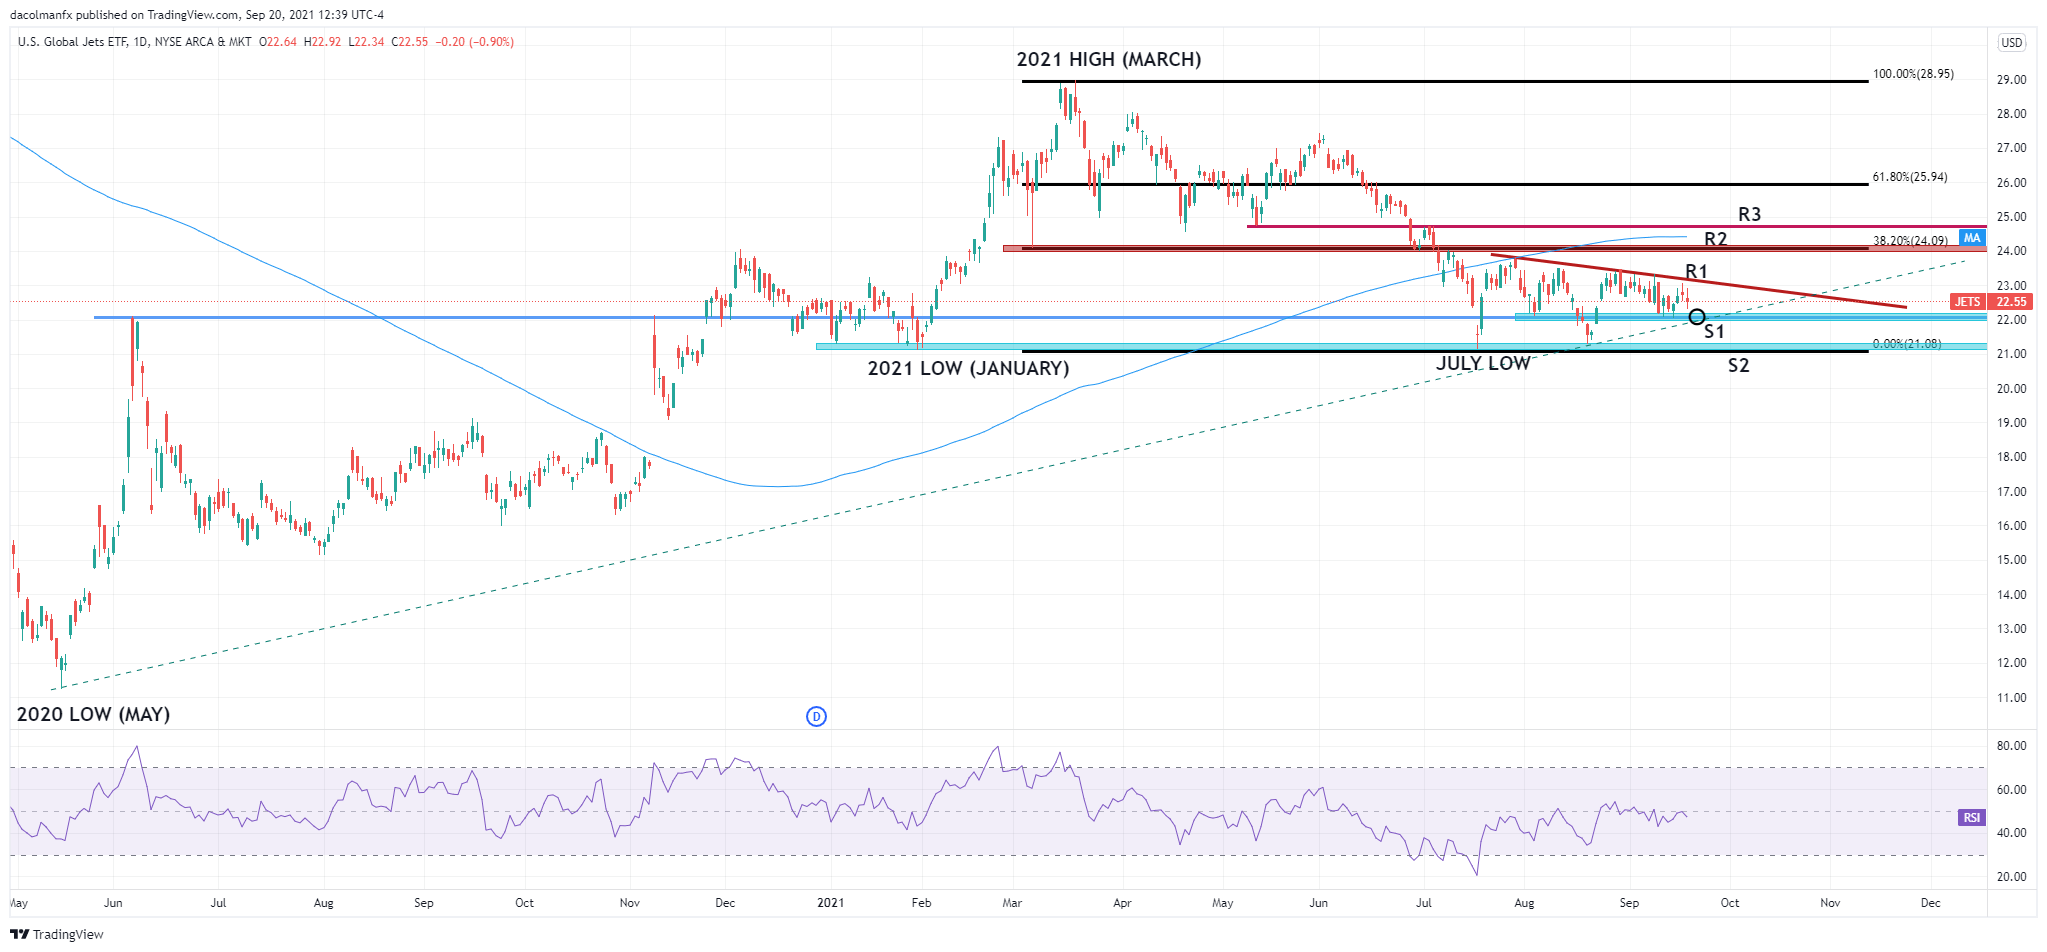
Looking at the daily JETS chart, resistance can be seen at 23.15, near a short-term descending trendline in play since late July. Should bulls push the price above this level, buying momentum could gain steam and pave the way for a move towards 24.13, a technical barrier created by the 38.2% Fibonacci retracement of the March/July pull-back? Lastly, a rise above 24.13 could expose the 24.75 mark.
On the downside, the first support to consider appears in the 22.00 psychological region. If this floor is invalidated, bears could reassert selling pressure and drive the JETS ETF towards its 2021 low in the 21.15 area.
JETS TECHNICAL CHART


Comments
Log in or sign up to join the conversation.