
S&P 500: More Upside Ahead?
Is relentless optimism the same thing as irrational exuberance? You have to ask yourself that question when you regard equity market charts nowadays. The S&P 500 has been on a tear recently, fueled by short-covering rallies in early February and fresh buying through mid-month.
You might have been able to forecast this rally a while ago if you kept track of the SPY-OEF spread. The SPDR S&P 500 ETF (NYSE Arca: SPY) is a tradable proxy for the U.S. market’s blue-chip benchmark. The iShares S&P 100 ETF (NYSE Arca: OEF) tracks a subset of SPY’s underlying index. The “OE” in its ticker symbol stands for “Options Exchange,” a reference to the Chicago bourse that originally devised its methodology. Back in 1983, the 100 largest--and optionable--components of the S&P 500 were selected by the Chicago Board Options Exchange to populate what was then known as the CBOE 100 Index. In the then-nascent exchange-traded option marketplace, only the most liquid stocks could be optioned and the Cboe had a corner on the blue chips. As a result, Cboe’s subset had, and has, a higher average market cap than its parent index. You could say that OEF represents the bluest of the blue chips.
Later, when ETFs based on the indices were subsequently launched, their relative pricing became a useful indicator of market sentiment. Originally, SPY was priced at a $45 premium to OEF. But, as you can see in the chart below, that premium grew to more than $186 in the ensuing decades.
(Click on image to enlarge)
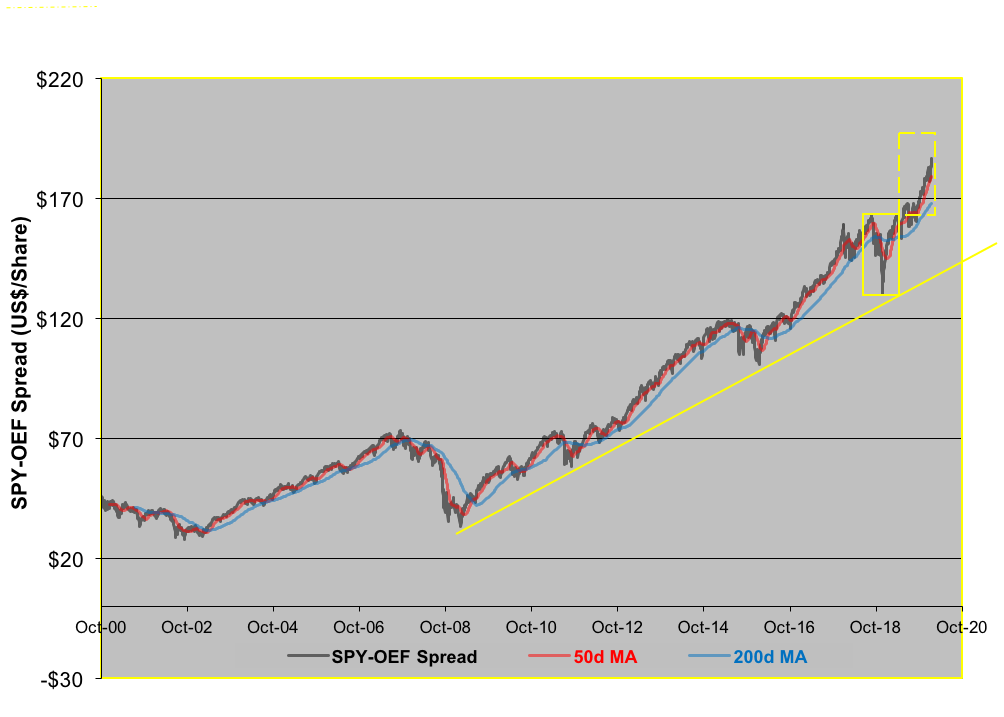
When you look at the spread, you see OEF with its mega-cap components as the staider and—dare we say it?—more defensive portfolio. The broader-based SPY is comparably more aggressive. Thus, when the SPY-OEF premium widens, equity investors seem more exuberant and willing to countenance the risk of “smaller” stocks. When the spread narrows, stock players pull in their horns to seek safety in the big issues.
In the past 10 trading days, the SPY-OEF premium reached five new highs, crawling up the wall of worry forecast by its 2018-2019 consolidation and trend line test. The questions now being asked by chart watchers are these: “Where’s the spread headed from here and how does that translate into an investable strategy?”
Clearly, the market is in high spirits. Along with the S&P’s new records is also a degree of market complacency reflected in SPY volume. So far this month, SPY’s average daily turnover is down 14 percent from January. SPY is used by large traders as a hedge and for the equitization of cash. ETF volume typically spikes at market turning points. This, apparently, isn’t an inflection point.
So what are we to take away from all this? That, for now at least, the trend is your friend. The SPY-OEF spread’s got the juju to reach the $195 level and, if held, $213 in the long term. That, barring the appearance of a honking black swan, translates to the potential for an additional 11- to 21-percent gain in the S&P 500.
Invest accordingly. But, as we cautioned you last week, keep your eyes open and on the exits.
Disclosure: None.


