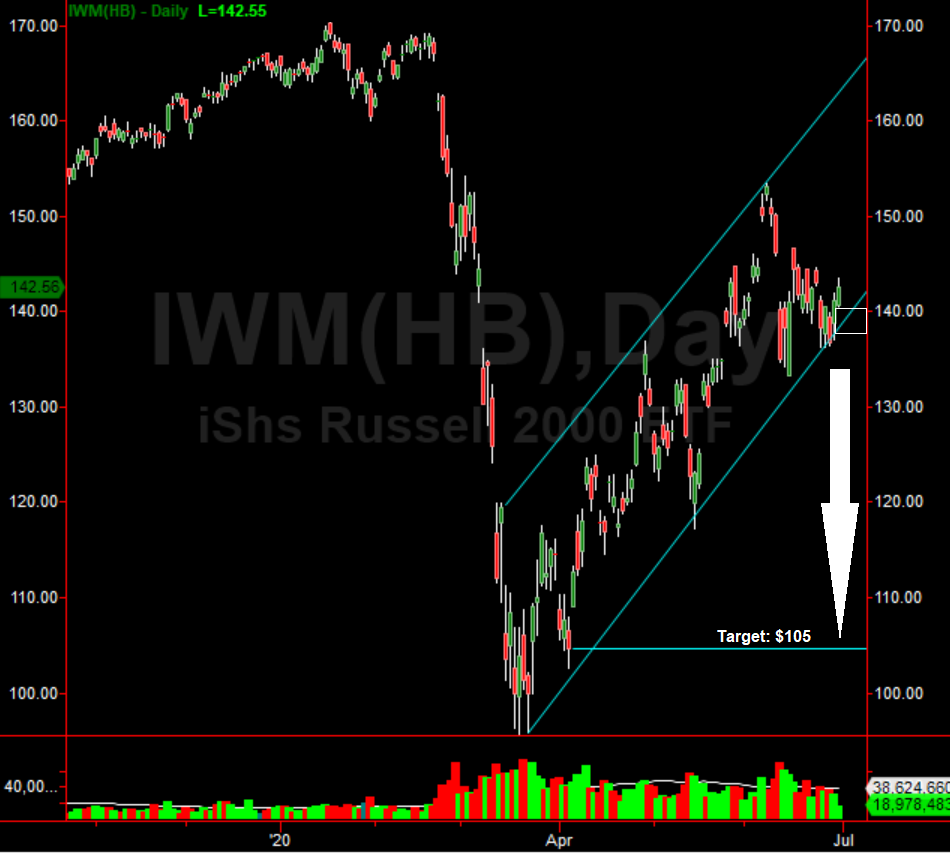
Russell 2000 Chart: 20% Drop When This Happens
The Russell 2000 chart is setting up for a nasty fall. A 20% or more drop will occur when the channel on the IWM (Russell 2000 ETF) chart breaks. As it stands now, the Russell 2000 chart is hammering on the lower range and could break as early as next week. This will set off a hard sell and likely fall to the target of $105.00.
As a stock trader/swing trader look for a break of the channel to the downside to pull the trigger on a short. Based on the calculations, it will break, just a matter of when, so even a small short can be taken at this point in time.
(Click on image to enlarge)

Disclosure: None.


Thanks Gareth, I'm keeping my fingers crossed! 🤞