


Image Source: Unsplash
In this technical article, we are going to present Elliott Wave charts of QQQ ETF. As our members know, QQQ is trading within the cycle from the 396 low. Recently, the ETF has reached the extreme zone from the April 9th peak and found buyers as expected. In the following sections, we will explain the Elliott Wave forecast.
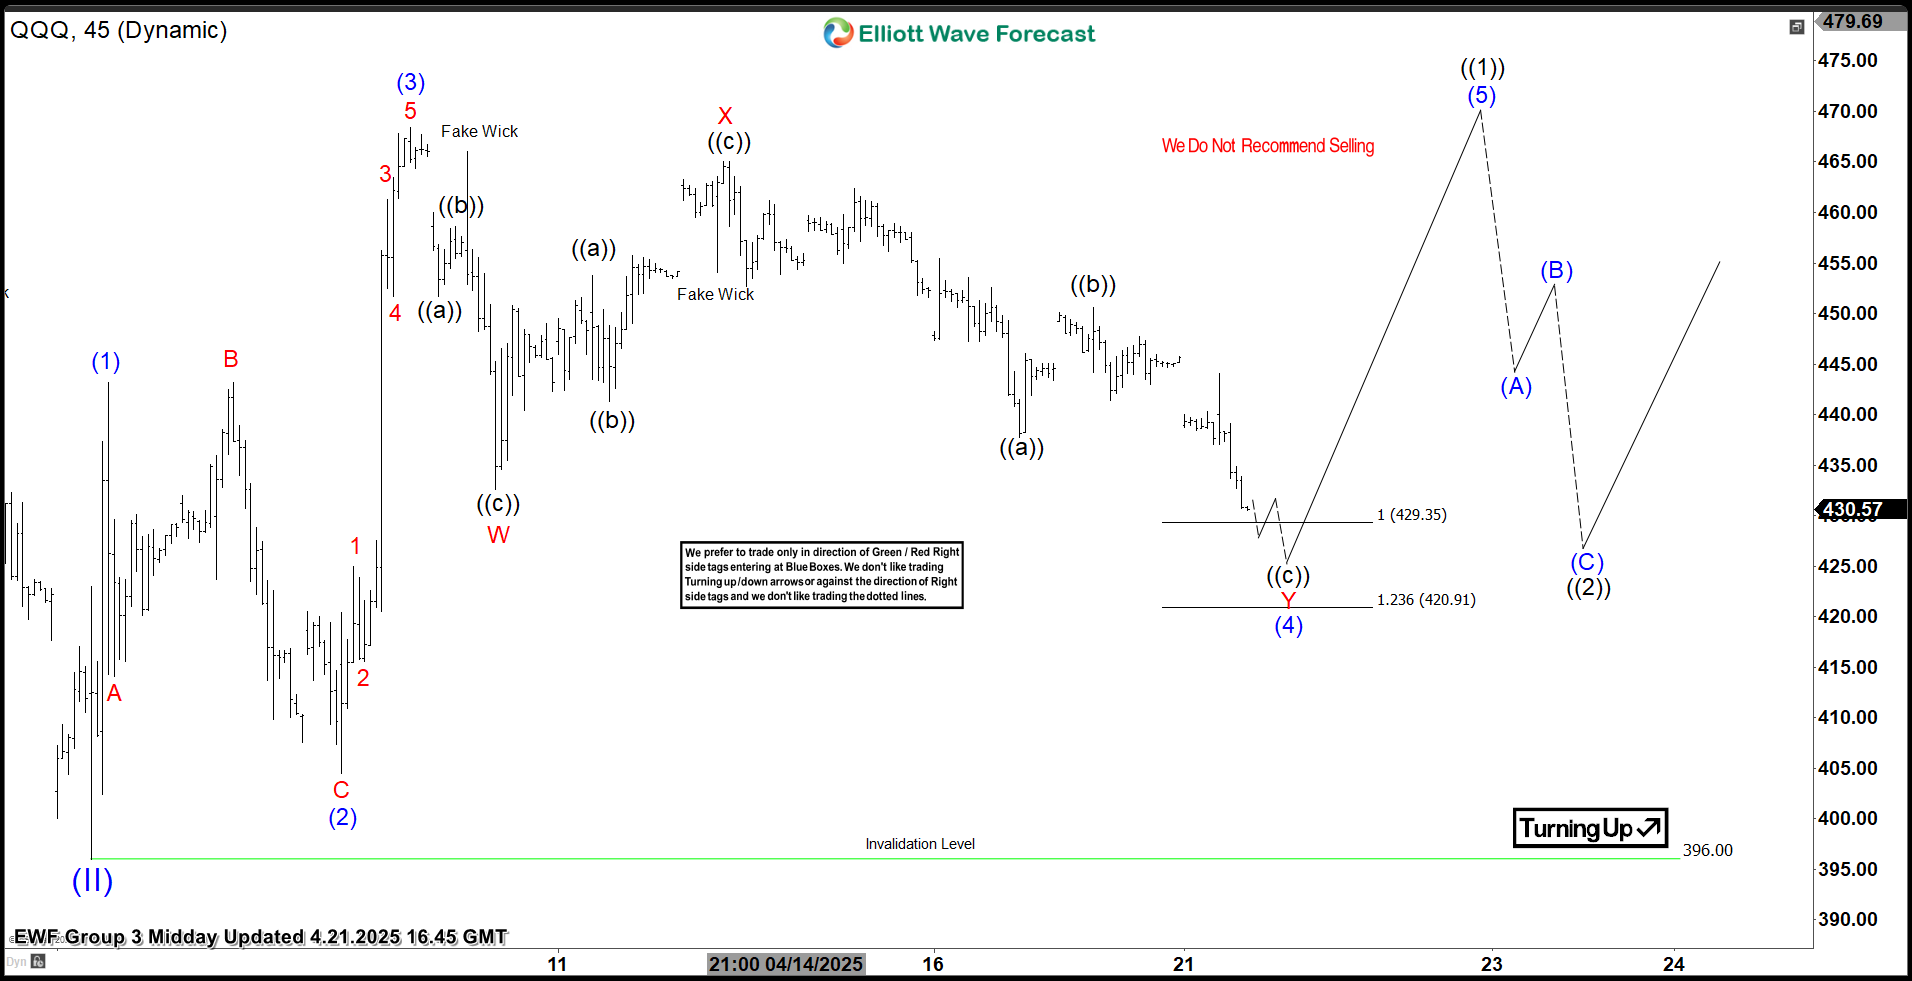
QQQ Elliott Wave 1 Hour Chart 04.21.2025
The current view suggests QQQ is about to complete the cycle from the peak. Correction is reaching the extreme zone at the 429.35-420.91 area. At that zone, buyers should re-enter, which could lead to a further rally toward new highs or in a 3-wave bounce at least. We recommend that members avoid selling QQQ and keep favoring the long side.
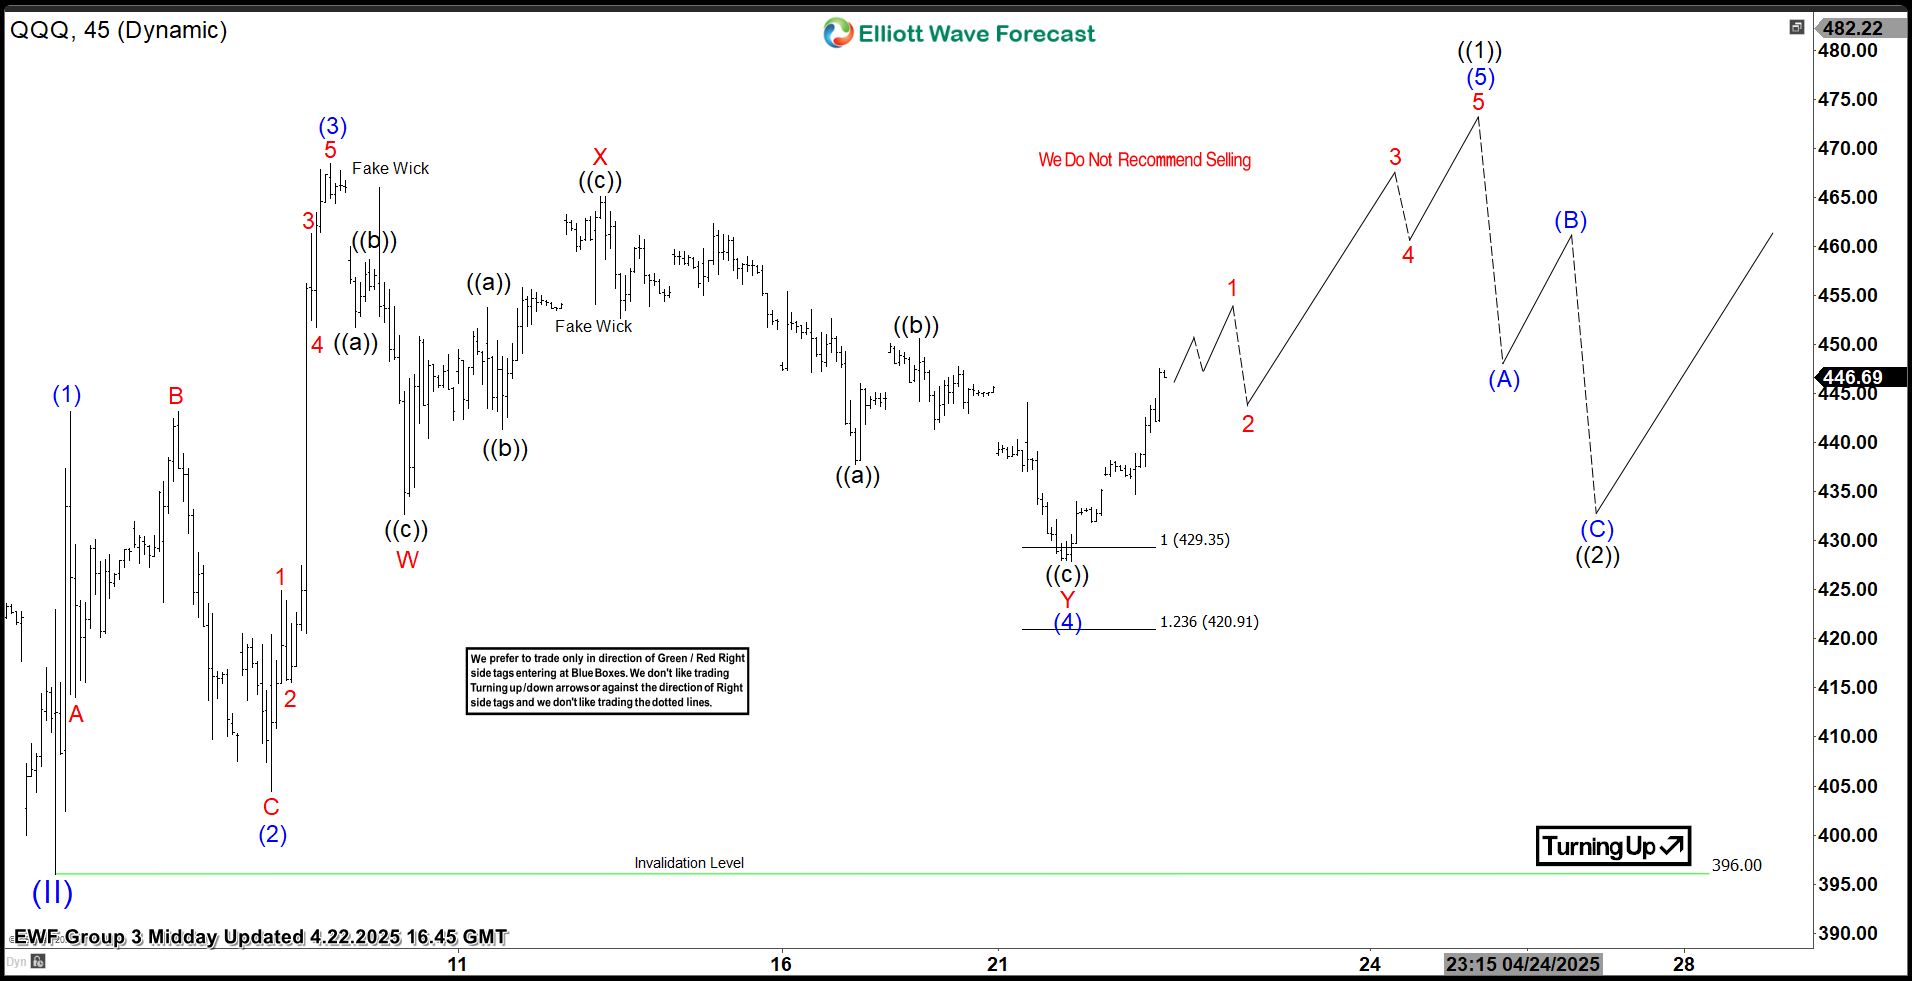
QQQ Elliott Wave 1 Hour Chart 04.10.2025
QQQ found buyers, and made a decent reaction from the Equal Legs zone: 429.35-420.91. The cycle from the peak ended at 428.3 low. As long as the price stays above that low, we can see further strength in the ETF. As a result, any long trades from the marked zone should be in risk-free positions with partial profits taken.
More By This Author:
Hindustan Copper Elliott Wave: Blue Box Support Delivers Another Bullish Reversal
Elliott Wave Analysis Indicates EURUSD Is Extending Higher In An Impulsive Structure
Elliott Wave Insight: Gold Miners ETF Surges In Strong Nested Impulse



Comments
Log in or sign up to join the conversation.