Elliott Wave Insight: Gold Miners ETF Surges In Strong Nested Impulse
Image Source: Unsplash
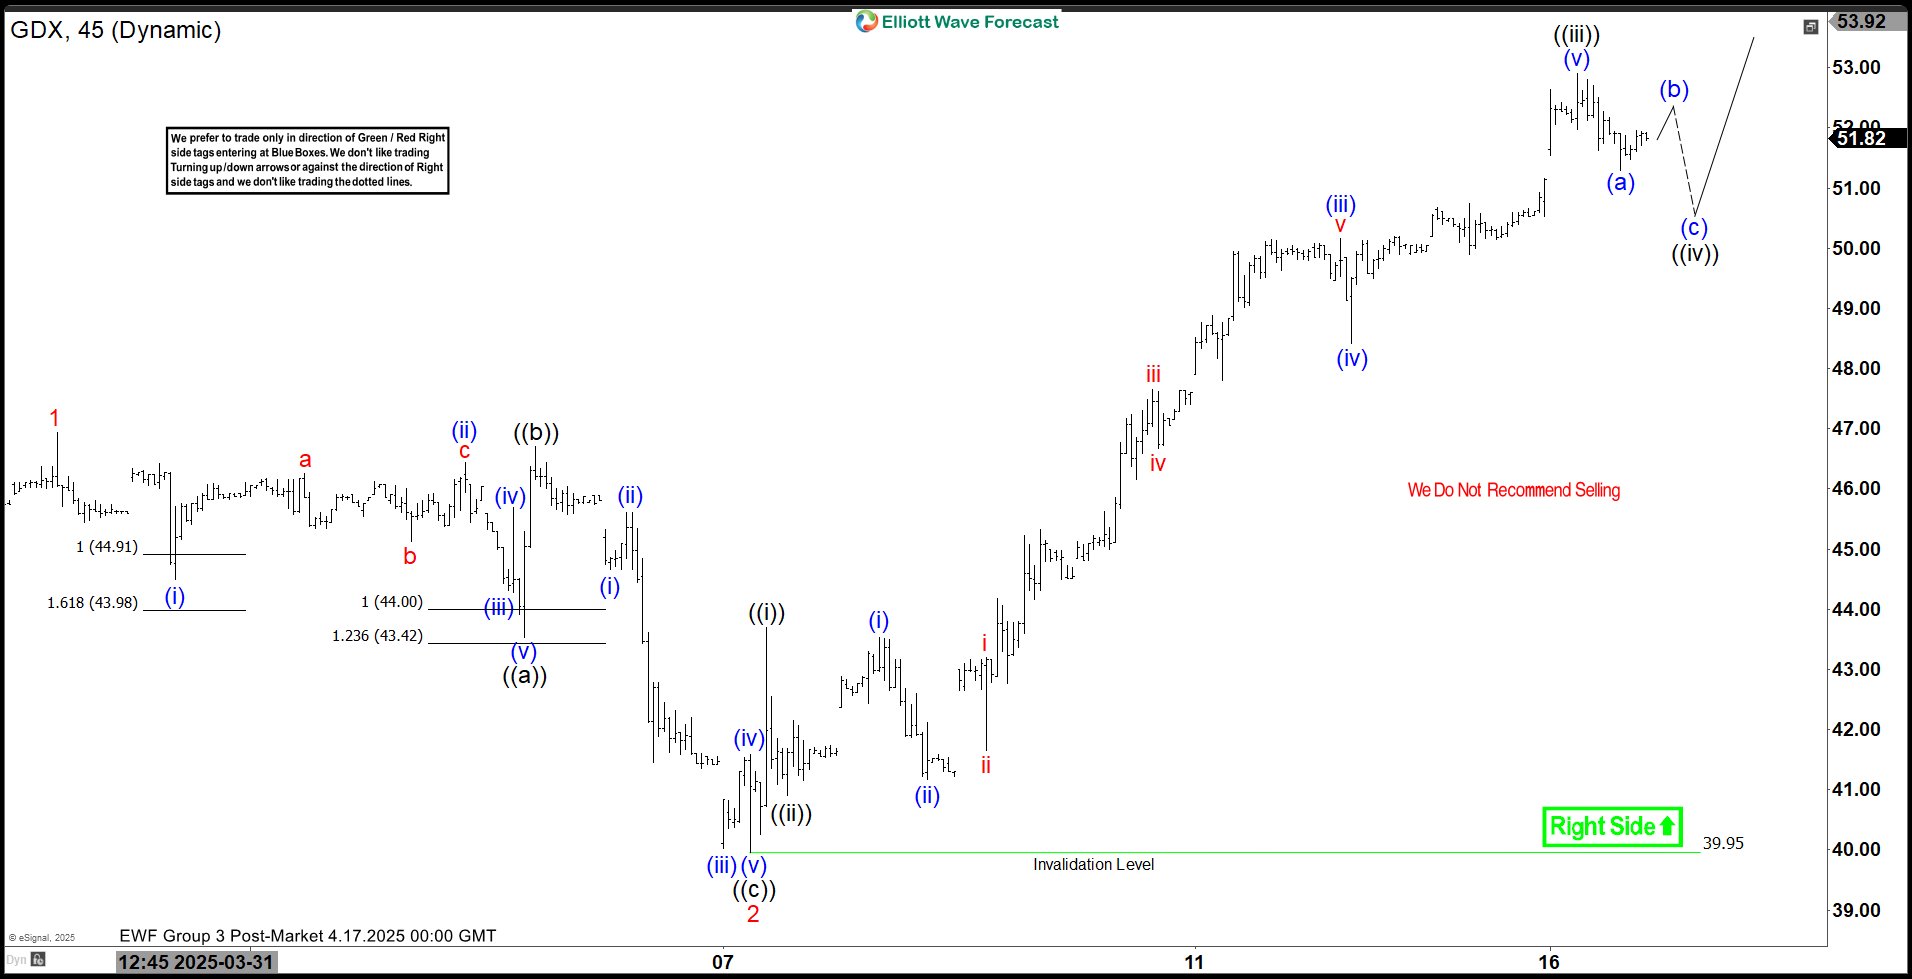
The Elliott Wave analysis for the VanEck Gold Miners ETF (GDX) shows a strong bullish trend since December 30, 2024. This rally forms a “nesting impulse” pattern with smaller waves building into an extended third wave. From the December low, wave (1) peaked at $42.66, followed by a wave (2) pullback to $38.58. GDX then entered a powerful wave (3) with nested sub-waves driving prices higher.
In wave (3), wave 1 rallied to $46.94, with wave 2 correcting to $39.95. Wave 3 extended upward, with sub-wave ((i)) ending at $43.70. Sub-wave ((ii)) corrected to $40.91, then sub-wave ((iii)) surged to $52.91. Strong bullish momentum continues to dominate the gold mining sector. A pullback in sub-wave ((iv)) is now expected, attracting buyers for sub-wave ((v)). This should complete wave 3 before a larger wave 4 correction.
As long as the $39.95 pivot holds, dips should find support. Support may form in a 3, 7, or 11-swing pattern. This signals more upside potential for GDX in the near term. Investors should watch these levels for strategic buying opportunities. The pattern suggests sustained interest in gold mining equities. Favorable commodity cycles likely contribute to this bullish sentiment.
Gold Miners (GDX) Elliott Wave Chart
GDX Video
Video Length: 00:03:34
More By This Author:
Elliott Wave Outlook Confirms That GBPUSD Has Resumed Its Upward MoveMicrosoft Poised For Gains: Elliott Wave Analysis Signals The Next Leg Up
QQQ ETF: Forecasting The Rally
Disclaimer: Futures, options, and over the counter foreign exchange products may involve substantial risk and may not be suitable for all investors. Leverage can work against you as well as for ...
more


