QQQ Completed A Cycle Expecting To Resume The Rally

Image Source: Pixabay
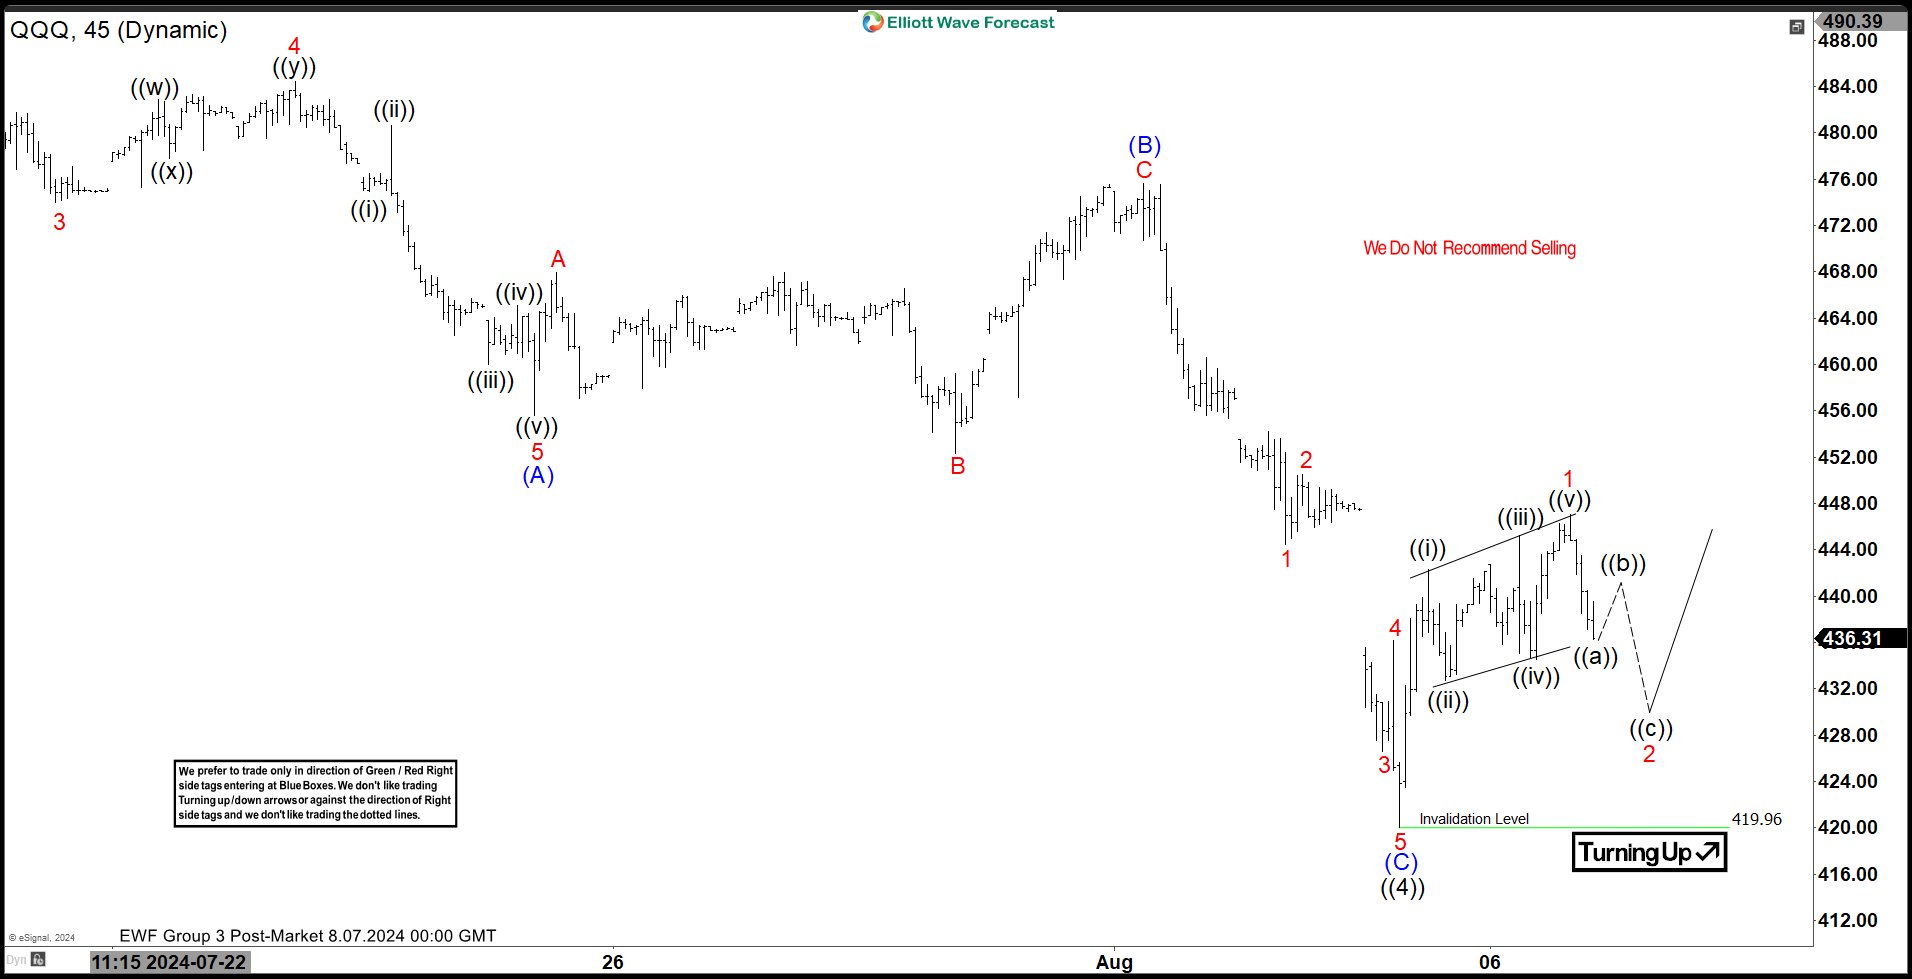
Short Term Elliott Wave in QQQ suggests that the ETF has completed a bearish sequence from 7.11.2024 high. The decline made a zig zag Elliott Wave structure. Down from 7.11.2024 high, wave (A) ended at 455.63 low. Rally in wave (B) ended at 475.61 with internal subdivision as a expanded flat structure. Up from wave (A), wave A ended at 467.94 and wave B ended at 452.31. Wave C higher ended at 475.61 which completed wave (B) in higher degree.
Then, QQQ turned lower in wave (C) with internal subdivision as an impulse structure. Down from wave (B), wave 1 ended at 444.47 and wave 2 ended at 450.49. Wave 3 lower ended at 426.59 and wave 4 ended at 436.17. Final leg wave 5 ended at 420.00 which completed wave (C) and ((4)) in higher degree. The current rally is in progress expecting to continue higher as wave ((5)). Near term, we are calling a leading diagonal as wave 1 of (1) of ((5)). This wave 1 ended at 447.07 high. Now, we are expecting to correct the cycle as wave 2 before resuming to the update in wave 3. The view is valid as price action stays above 420.00 low.
QQQ 45 Minutes Elliott Wave Chart
QQQ Elliott Wave Video
Video Length: 00:04:23
More By This Author:
Deckers Outdoor Favors Sideways Correction Before Rally AgainOil Should Continue Lower To Build An Impulsive Structure
Destra Network DSYNC Started New Bullish Sequence
Disclaimer: Futures, options, and over the counter foreign exchange products may involve substantial risk and may not be suitable for all investors. Leverage can work against you as well as for ...
more


